
Why Knowles (KN) Is Back In The Spotlight
Knowles (KN) has drawn fresh attention after a recent share price move that leaves the stock trading around $34.78, with performance mixed between strong year-to-date gains and weaker one-month and past three-month returns.
The recent pullback, including a 30-day share price return that is down 9.69% and a 90-day share price return that is down 13.55%, comes after a strong run. Knowles has posted a year-to-date share price return of 58.45% and a 3-year total shareholder return of 129.57%. This points to long-term momentum but softer short-term sentiment as investors reassess growth prospects and risk around the current US$34.78 level.
Compare Knowles with other hand-picked manufacturers exposed to medtech, defense and industrial demand by scanning the list of solid balance sheet and fundamentals (22 results) alongside this stock's recent moves.
After that sharp run and recent pullback, Knowles now trades well below the US$43.75 analyst target yet above some tighter intrinsic estimates. Where does a reasonable fair value range actually land for this stock today?
Most Popular Narrative: 28% Undervalued
On the most widely followed narrative, Knowles screens at a fair value of $48.00 versus the last close at $34.78. This frames the current debate around how durable its earnings and margin profile can be.
Knowles' increased investments in capacity expansion and entry into new product categories, such as its inductor line and expanded specialty film, could unlock meaningful new addressable markets, driving sustained double-digit revenue growth and margin improvement over multiple years.
See why 3 investors see Knowles as 28% undervalued.
That storyline uses an 8.98% discount rate and assumes Knowles can lift profit margins from 11.5% to 18.4%, with revenue growth of roughly 9.6% each year and earnings rising from $73.2m to $153.2m by around 2029. Analysts in that camp also expect the stock to trade on a future P/E of 34.9x, slightly below the current multiple but above the broader US Electronic industry level. This implies investors would still be paying a premium for that earnings trajectory.
On those inputs, the $48.00 fair value sits about 27.5% above the Simply Wall St modeled estimate of intrinsic value using the same narrative, and around 28% above the current share price, while remaining within the analyst target band of $40.00 to $48.00. For anyone weighing that framework, the key question is whether those higher margin and growth assumptions, plus a premium P/E multiple, feel realistic for a business that currently generates $635.0m of revenue and $73.2m of net income across medtech, defense and industrial end markets.
Result: Fair Value of $48.00 (UNDERVALUED)
Still, the bullish Knowles story leans on a few fault lines, including customer concentration and pressure from low cost MEMS competitors that could limit its pricing power.
Find out about the key risks to this Knowles narrative.
Another View: Knowles On Earnings Multiples
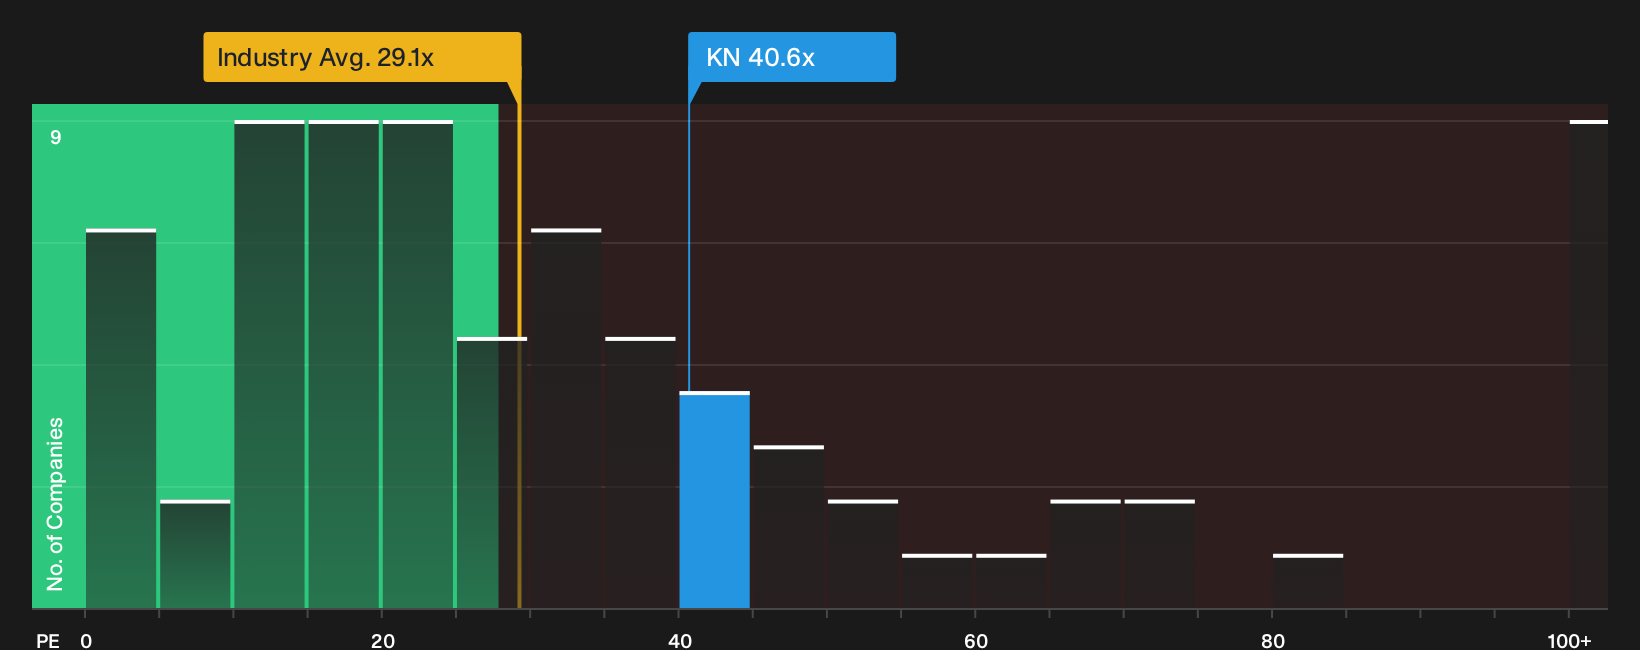
A second lens on Knowles comes from its P/E ratio. The stock trades on 40.6x earnings, which is higher than the US Electronic industry at 29.3x and above a fair ratio of 28.9x. That points to a richer tag and raises the question of how much good news is already in the price.
For a closer look at how this earnings multiple stacks up against sector peers and that fair ratio the market could move toward over time, See what the numbers say about this price — find out in our valuation breakdown.
Next Steps
If the mixed sentiment on Knowles has you undecided, review the numbers directly and examine each assumption carefully. To understand what the current optimism is based on, review the 3 key rewards.
Looking for more investment ideas beyond Knowles?
If Knowles has sharpened your focus on valuation and quality, broaden your watchlist using targeted stock ideas surfaced by Simply Wall St’s screeners.
- Target rock solid balance sheets and healthy fundamentals by scanning the list of solid balance sheet and fundamentals (22 results) that meet strict financial resilience filters.
- Hunt for quality businesses trading below estimated worth with the 34 high quality undervalued stocks before other investors start paying attention.
- Lock in potential income opportunities by checking the 6 dividend fortresses that pair higher yields with a focus on stability.
This article by Simply Wall St is general in nature. We provide commentary based on historical data and analyst forecasts only using an unbiased methodology and our articles are not intended to be financial advice. It does not constitute a recommendation to buy or sell any stock, and does not take account of your objectives, or your financial situation. We aim to bring you long-term focused analysis driven by fundamental data. Note that our analysis may not factor in the latest price-sensitive company announcements or qualitative material. Simply Wall St has no position in any stocks mentioned.
Have feedback on this article? Concerned about the content? Get in touch with us directly. Alternatively, email editorial-team@simplywallst.com