
3 Energy Stocks With Direct Exposure to Higher Oil and Gas Prices
Energy markets have swung from background noise to front page drama, with oil above $108 a barrel and gas costs squeezing households and businesses. That kind of shock can hurt some sectors and help others, which is exactly where opportunity often hides. This article examines how the current turmoil affects global stocks and highlights 3 integrated oil and gas producers that appear closely exposed to the latest headlines.
The three stocks below are just a starter set. The full screen surfaced 23 more large integrated oil and gas producers with equally compelling narratives that are not covered here.
To go straight to the source, analyze and identify your own highest conviction ideas using the Global Integrated Oil & Gas Producers screener.
Peabody Energy (BTU)
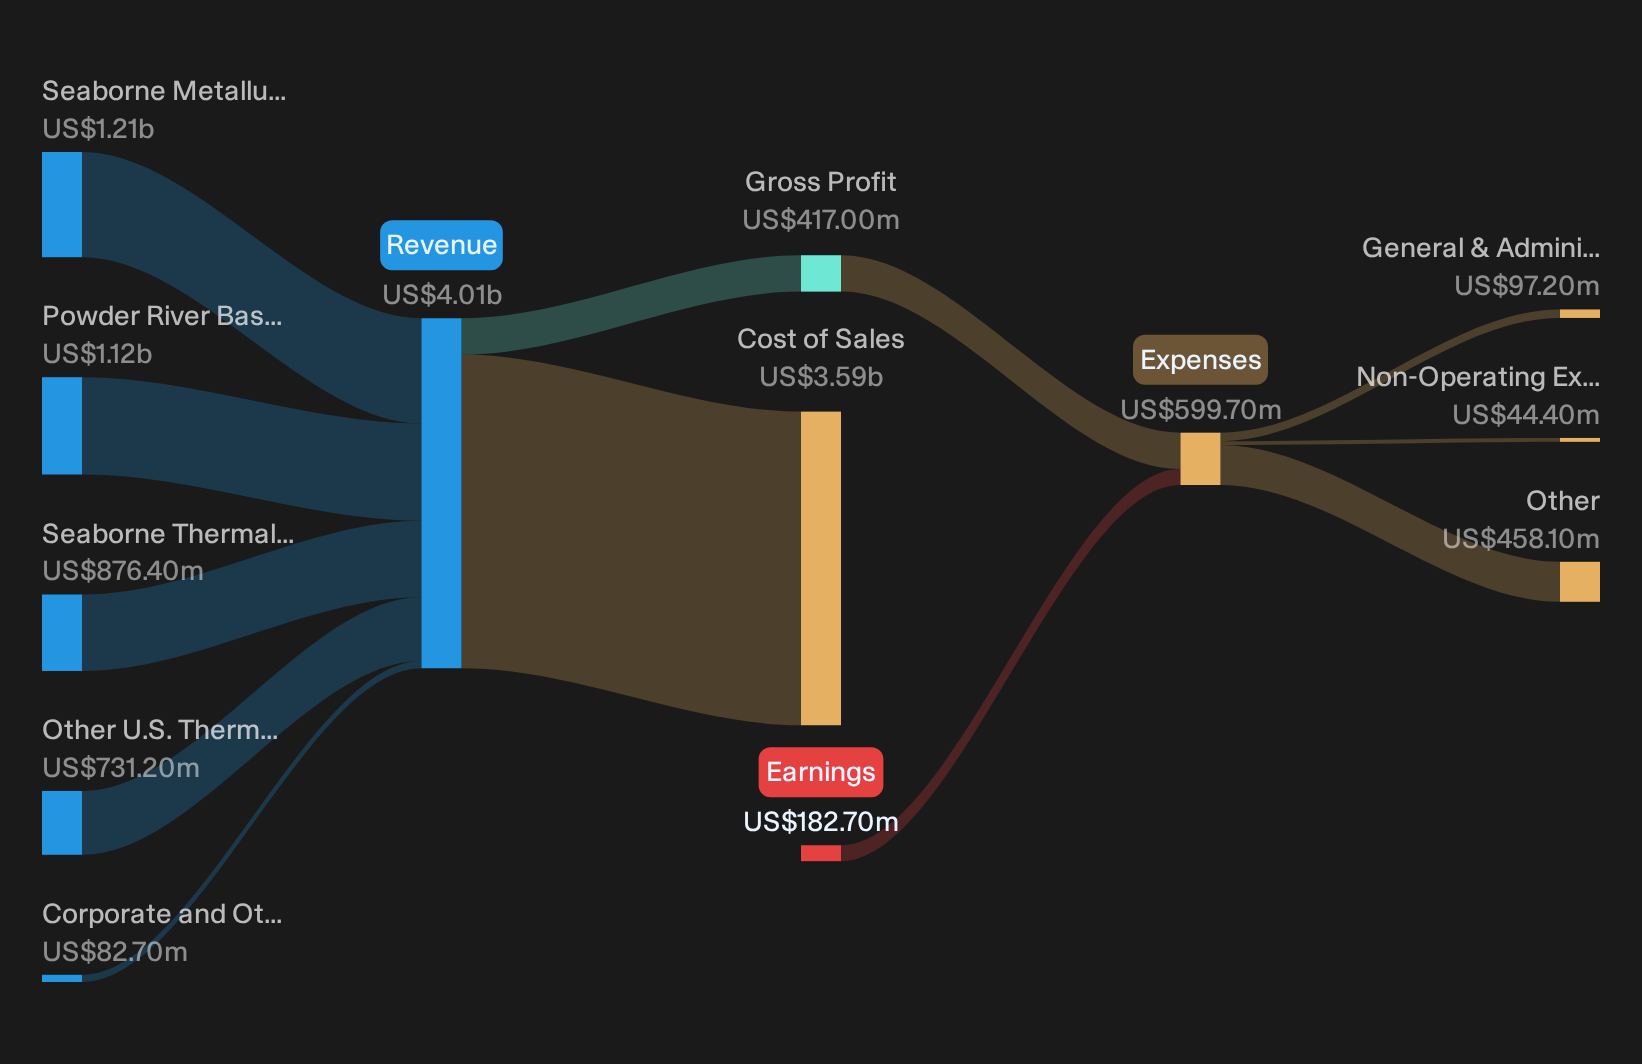
Peabody Energy is in this Global Integrated Oil & Gas Producers screen as a large US$3.3b coal miner whose metallurgical and thermal output ties its fortunes to global energy demand and power reliability rather than crude pricing alone.
Peabody splits its operations across Seaborne Metallurgical (about US$1.2b of revenue), Powder River Basin (around US$1.1b), Seaborne Thermal (roughly US$876 million) and Other U.S. Thermal (about US$731 million), giving it a diversified mix of coal supply across power generation and steelmaking customers.
Persistent cost control and capital discipline, together with the potential to unlock over half a billion dollars in restricted cash through progress on reclamation bonding, materially increases Peabody's capacity to fund shareholder returns and reinvestment initiatives.
What happens to Peabody Energy’s earnings power if one unresolved pressure on long term coal demand starts to ease rather than tighten?
If that inflection point matters to you, read the full narrative for Peabody Energy to see how Peabody Energy's reclamation cash, earnings mix, and risks could be decoupling.
Cardinal Energy (TSX:CJ)
Cardinal Energy is a Canadian oil and gas producer whose fortunes are closely aligned with the Global Integrated Oil & Gas Producers theme. Its entire CA$550 million of Oil & Gas Exploration & Production revenue and roughly CA$2.1b market value are tied directly to commodity benchmarks.
Higher crude and gas benchmarks feed straight into Cardinal Energy’s cash generation, so this producer often features when investors want direct exposure to price swings rather than complex refining or trading models.
Low debt, with room to issue more to cover dividend or existing growth project if needed by YE 2025 as a low fiscal risk position. This allows for strategic M&A if a downturn occurs, supporting efforts to pull ahead of competition.
The real hinge for Cardinal Energy is how one less visible production growth lever interacts with that commodity exposure and balance sheet flexibility.
That quiet lever could be doing far more work than the headline commodity story, and the full narrative for Cardinal Energy shows how Cardinal Energy’s cycle exposure might be quietly accelerating.

Santos (ASX:STO)
Santos gives you a direct line into the Global Integrated Oil & Gas Producers theme, with a broad mix of hydrocarbon exploration, production, transport and marketing across Australia, Papua New Guinea and Alaska. Revenue leans heavily on Papua New Guinea at about US$2.4b, followed by Queensland & NSW at roughly US$1.0b, Western Australia at about US$735 million, the Cooper Basin at around US$495 million and Northern Australia & Timor-Leste at roughly US$422 million. The group carries an A$28.3b market value that firmly anchors it in the large cap end of the sector.
Santos appears tightly wired into today’s energy shock story, with LNG and oil volumes that link directly into price moves while still offering diversified upstream and midstream exposure. This is the sort of profile this integrated screen is built to surface.
The recovery is described as being supported by Santos’ low operating break-even of below $35 per barrel, solid cash flows, and major projects including Barossa LNG and Pikka, which are expected to influence production and free cash flow.
What happens to Santos’ payout, balance sheet flexibility and growth options if a single pressure on long term LNG pricing breaks one way or the other?
If that swing factor is on your radar, the full narrative for Santos shows how Santos’ project pipeline, cash generation and risk profile could be quietly recalibrating.

Seeking Alternatives Before Momentum Flies
Markets move fast and fresh opportunities rarely stay under the radar for long. Some ideas are already building breakout momentum while others get caught dropping. Do not delay, get in early.
- Spot cash generative outliers early by scanning the list of solid balance sheet and fundamentals (22 results) that have the financial strength to keep funding operations even when conditions get rough.
- Ride secular tech momentum by tracking the 60 AI infrastructure stocks powering data centers, networking gear and compute capacity while the story is still under the radar for now.
- Add a different cycle to your watchlist by reviewing the curated 35 elite gold producer stocks that may behave very differently to your existing holdings when stress rises.
This article by Simply Wall St is general in nature. We provide commentary based on historical data and analyst forecasts only using an unbiased methodology and our articles are not intended to be financial advice. It does not constitute a recommendation to buy or sell any stock, and does not take account of your objectives, or your financial situation. We aim to bring you long-term focused analysis driven by fundamental data. Note that our analysis may not factor in the latest price-sensitive company announcements or qualitative material. Simply Wall St has no position in any stocks mentioned.
Have feedback on this article? Concerned about the content? Get in touch with us directly. Alternatively, email editorial-team@simplywallst.com