
Why Everyone Is Watching ASA Gold And Precious Metals (ASA) Today
ASA Gold and Precious Metals (ASA) drew fresh attention after recent trading left the closed-end fund with an indicated intrinsic discount of about 38%, prompting investors to reassess its exposure to precious metals equities.
Recent trading has been choppy for ASA Gold and Precious Metals, with the share price slipping 9.07% over the past week and easing over the past quarter. Yet the fund still shows very strong long term momentum, with a 3 year total shareholder return of about 299% and a 5 year total shareholder return of about 198%, which helps anchor the current 38% indicated discount story.
Spot similar deep-value setups in precious metals by scanning the 36 elite gold producer stocks, which filters for producers with the kind of volatility and potential discount that ASA Gold and Precious Metals investors are watching.Bulls see ASA Gold and Precious Metals as a rare 38% discount on a hard asset portfolio, while bears point to recent volatility and sector risk. Which case does the valuation actually support next?
Price-to-Earnings of 1.4x: Is it justified?
ASA Gold and Precious Metals trades on a P/E of 1.4x, which looks very low next to peers while the share price sits at $57.25 and the fund is flagged as trading around a 38% intrinsic discount.
The P/E ratio compares what investors pay for each dollar of recent earnings. For an investment vehicle like ASA Gold and Precious Metals, which owns a portfolio of precious metals equities, this measure reflects how the market is pricing those underlying earnings streams that flow through to the fund's reported profits.
ASA Gold and Precious Metals is assessed as good value on this yardstick compared with a peer average P/E of 20.9x, and looks even cheaper beside the broader US Capital Markets industry at 39.9x. That gap suggests investors are assigning a far lower earnings multiple to ASA's portfolio than to many other listed capital markets businesses, despite the fund reporting very strong recent earnings growth that includes a very large one off gain and a 53.7% return on equity.
Result: Price-to-Earnings of 1.4x
See what the numbers say about this price — find out in our valuation breakdown.
Still, the ASA Gold and Precious Metals story can unwind quickly if precious metals equities re-rate lower or if the current 38% discount narrows only slowly.
Find out about the key risks to this ASA Gold and Precious Metals narrative.
Another view on ASA Gold and Precious Metals
The earnings multiple paints ASA Gold and Precious Metals as very cheap, yet the SWS DCF model points to something different. On that framework, our DCF model suggests a fair value of $93.06 per share compared with the current $57.25 price, implying ASA trades well below the estimated future cash flow value.
This kind of gap can signal mispricing, or it can reflect real concern about how dependable those cash flows are. The key question for you is whether the DCF assumptions around future portfolio cash generation feel realistic or demand too much conviction from a precious metals fund.
Look into how the SWS DCF model arrives at its fair value.
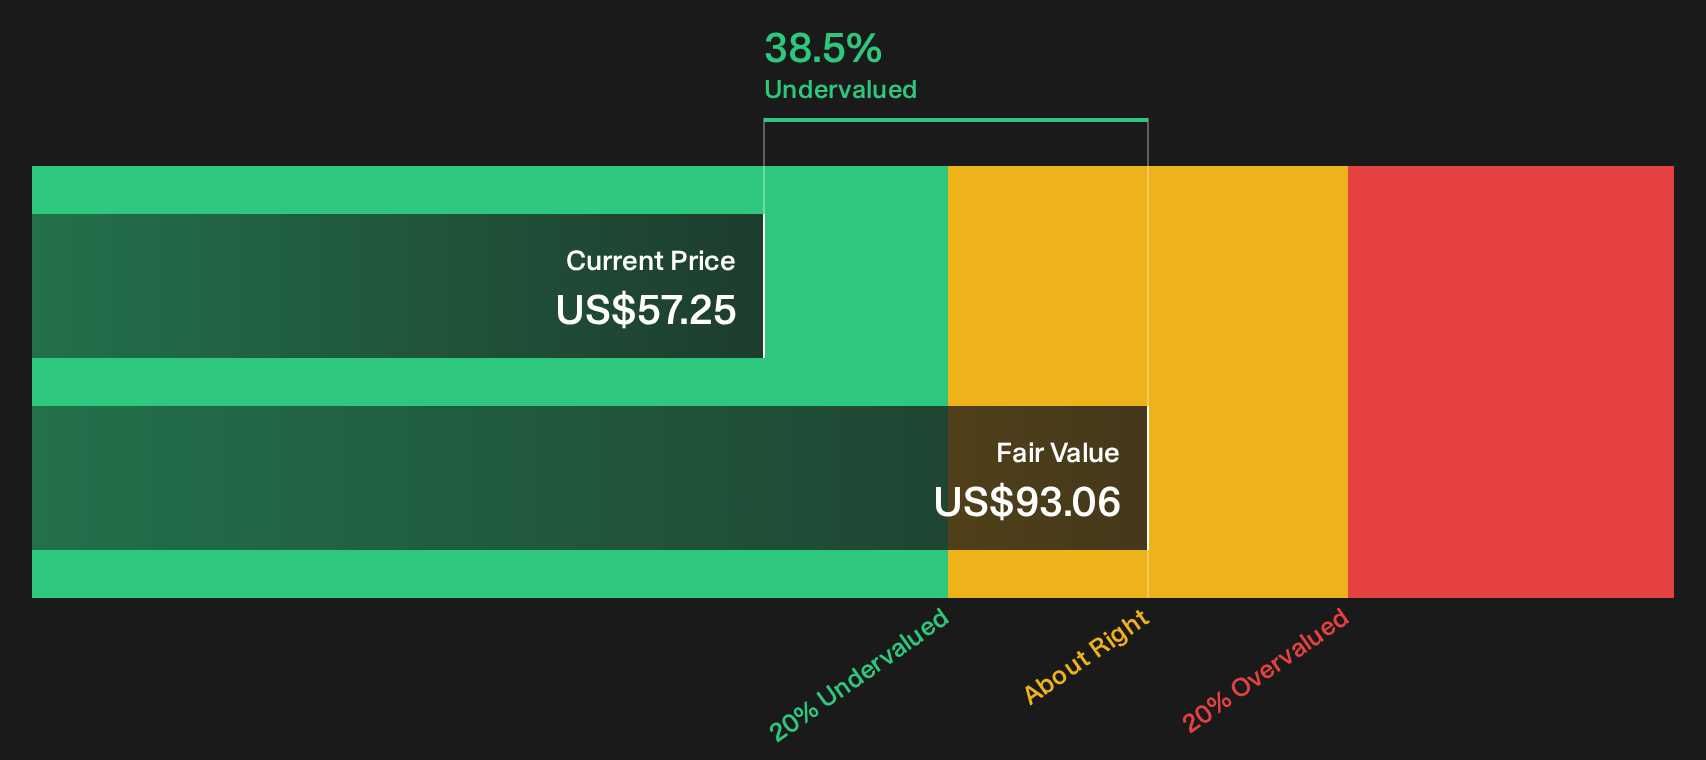
Simply Wall St performs a discounted cash flow (DCF) on every stock in the world every day (check out ASA Gold and Precious Metals for example). We show the entire calculation in full. You can track the result in your watchlist or portfolio and be alerted when this changes, or use our stock screener to discover 33 high quality undervalued stocks. If you save a screener we even alert you when new companies match - so you never miss a potential opportunity.
Next Steps
Mixed signals on ASA Gold and Precious Metals so far. If you want a clearer view of the balance between risk and potential upside, start by weighing the 2 key rewards and 1 important warning sign.
Looking for more ASA Gold and Precious Metals sized ideas?
If ASA Gold and Precious Metals has you rethinking where the next edge might come from, use the Simply Wall Street Screener to spot other potential outliers before they move.
- Target resilience first by running through a 11 resilient stocks with low risk scores that limits exposure to fragile balance sheets when markets turn rough.
- Hunt for quality at a discount by scanning our 16 high quality undiscovered gems loaded with companies that have strong fundamentals but limited current attention.
- Prioritise financial strength by focusing on a list of solid balance sheet and fundamentals (22 results) that surfaces businesses with cleaner leverage and sturdier cash positions.
This article by Simply Wall St is general in nature. We provide commentary based on historical data and analyst forecasts only using an unbiased methodology and our articles are not intended to be financial advice. It does not constitute a recommendation to buy or sell any stock, and does not take account of your objectives, or your financial situation. We aim to bring you long-term focused analysis driven by fundamental data. Note that our analysis may not factor in the latest price-sensitive company announcements or qualitative material. Simply Wall St has no position in any stocks mentioned.
Have feedback on this article? Concerned about the content? Get in touch with us directly. Alternatively, email editorial-team@simplywallst.com