
Bure Equity (OM:BURE) Momentum Puts Its Low Valuation Back In Focus
Bure Equity (OM:BURE) has drawn investor attention after its recent share performance, with the stock now priced at SEK 307.8 and showing positive total returns over the past year and past 3 months.
Bure Equity’s recent 30-day share price return of 11.76% and 90-day share price return of 20.05% point to building momentum. The 1-year total shareholder return of 13.16% and 3-year total shareholder return of 48.30% show a stronger record over the medium term than over five years, where total shareholder return declined 14.16%.
Scan for other potential momentum stories alongside Bure Equity by reviewing our hand picked list of 189 high quality undervalued stocks that currently combine quality fundamentals with discounted prices.
Bure Equity’s recent surge puts bulls arguing for a valuation reset against bears who see stretched enthusiasm. Which side does the current price and intrinsic value gap support as you weigh what the shares might be worth today?
Price-to-Earnings of 4.6x: Is it justified?
Bure Equity screens as inexpensive on a headline basis, with a P/E of 4.6x against a last close of SEK 307.8 and a large intrinsic discount flagged by the SWS DCF model. That combination raises a clear question for investors. Is the market correctly pricing risk, or is it overly cautious about this investment group?
The P/E ratio compares what you pay per share to the earnings generated per share. For a private equity style business like Bure Equity, this metric ties directly to how the market values its current profit stream rather than its underlying portfolio valuations alone. A lower P/E can indicate that investors are placing a heavier discount on those earnings, often because they see volatility, cyclicality, or uncertainty around how repeatable they are.
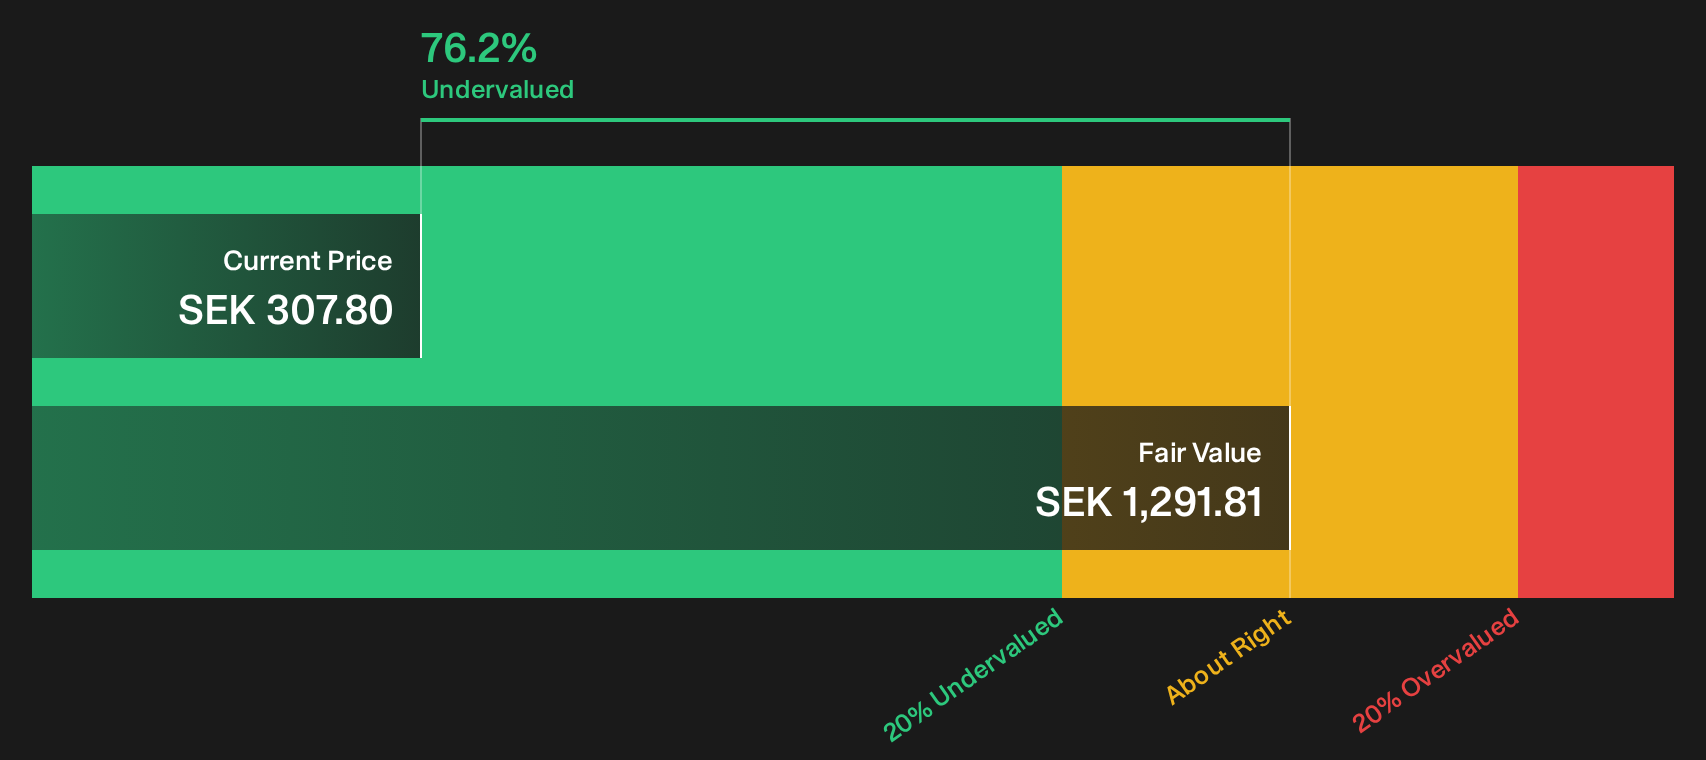
Against that backdrop, the valuation signals are mixed. Bure Equity has become profitable in the past year and is described as having high quality earnings, yet profits have declined 6% per year over the past five years and there is insufficient data on future earnings growth. That tension between a recent return to profitability and a weaker longer trend gives context to why the stock might trade on a low earnings multiple even as the SWS DCF model flags it as trading at 76.2% below its estimated fair value and at a large discount to an estimated future cash flow value of SEK 1,291.81 per share.
The market comparison is stark. Bure Equity is labelled good value based on its 4.6x P/E versus both the Swedish Capital Markets industry average of 17.5x and a peer average of 15.9x. This is a very wide gap for a profitable investment group with seasoned management and an experienced board. Those relative figures suggest investors are pricing Bure Equity at a deep discount to sector and peer expectations.
See what the numbers say about this price — find out in our valuation breakdown.
Result: Price-to-Earnings of 4.6x (UNDERVALUED)
Still, the lack of visible revenue or net income growth data, along with the 14.16% decline in 5-year total shareholder return, could challenge a simple undervaluation story.
Find out about the key risks to this Bure Equity narrative.
Another View: What The DCF Model Says About Bure Equity
The SWS DCF model paints a very different picture for Bure Equity. At a share price of SEK 307.8, the stock is flagged as trading 76.2% below an estimated future cash flow value of SEK 1,291.81 per share. That points to a deep undervaluation based on long term cash generation rather than near term earnings multiples.
This wide gap between market price and DCF estimate leaves you with a practical question. Is the market correctly discounting uncertainty around future profits, or is the current price overly cautious compared to the cash flow profile implied by our model?
Look into how the SWS DCF model arrives at its fair value.
Simply Wall St performs a discounted cash flow (DCF) on every stock in the world every day (check out Bure Equity for example). We show the entire calculation in full. You can track the result in your watchlist or portfolio and be alerted when this changes, or use our stock screener to discover 189 high quality undervalued stocks. If you save a screener we even alert you when new companies match - so you never miss a potential opportunity.
Next Steps
Mixed signals on Bure Equity’s valuation and outlook make this a judgment call that data driven investors need to own for themselves. If you want a single place to weigh both the concerns and the potential upside before deciding how to act, start with the 2 key rewards and 1 important warning sign
Looking for more investment ideas beyond Bure Equity?
If Bure Equity has sharpened your focus on valuation gaps and quality, do not stop here. Use the Simply Wall St screener to explore more opportunities that fit your style.
- Focus on strong balance sheets and steady fundamentals by scanning the list of solid balance sheet and fundamentals (194 results).
- Identify potential bargains that pair quality financials with discounted valuations by reviewing the 189 high quality undervalued stocks.
- Look for under-the-radar opportunities with solid foundations by checking the 619 high quality undiscovered gems.
This article by Simply Wall St is general in nature. We provide commentary based on historical data and analyst forecasts only using an unbiased methodology and our articles are not intended to be financial advice. It does not constitute a recommendation to buy or sell any stock, and does not take account of your objectives, or your financial situation. We aim to bring you long-term focused analysis driven by fundamental data. Note that our analysis may not factor in the latest price-sensitive company announcements or qualitative material. Simply Wall St has no position in any stocks mentioned.
Have feedback on this article? Concerned about the content? Get in touch with us directly. Alternatively, email editorial-team@simplywallst.com