
TOMY Company (TSE:7867) Shares Climbed, What Is Behind The Attention?
TOMY Company (TSE:7867) has drawn fresh attention after its recent share move, with the price closing at ¥4,046 and short term returns outpacing its longer term track record.
Recent trading has come on top of stronger momentum in TOMY Company, with a 1-week share price return of 15.17% and a 90-day share price return of 38.30%. This has contributed to a 1-year total shareholder return of 30.00% and a 5-year total shareholder return of 287.06%.
Scan beyond TOMY Company and see how it stacks up against other consumer-focused businesses with strong recent moves using the hand picked 74 high quality undiscovered gems.
Bulls argue TOMY Company’s recent surge reflects a meaningful gap to intrinsic value. Bears see a hot chart and frothy expectations. Which side do the current valuation markers actually support?
Price-to-Earnings of 28.2x: Is it justified?
TOMY Company looks expensive on a simple snapshot, with a P/E of 28.2x sitting well above several key benchmarks even after the latest close at ¥4,046.
The P/E ratio compares what investors are paying today for each unit of current earnings. For a consumer toys and leisure business like TOMY Company, it often reflects how much faith the market has in the stability of earnings and the brand strength behind products such as Tomica, Plarail and Transformers.
At 28.2x, the market is assigning a far richer tag to TOMY Company than both the JP Leisure industry average of 15.4x and the peer average of 13.2x. It also sits well above the estimated fair P/E of 17.9x that our fair ratio work suggests the market could eventually lean toward, which points to a strong premium already embedded in the price.
Explore the SWS fair ratio for TOMY Company.
Result: Price-to-Earnings of 28.2x (OVERVALUED)
DCF fair value points to a different story
On the SWS DCF model, TOMY Company screens as undervalued, with the shares at ¥4,046 compared with an estimated future cash flow value of ¥6,585.29.
The DCF approach projects TOMY Company’s expected cash flows and discounts them back to today, aiming to capture what those yen are worth in present terms rather than only looking at current earnings. That can be useful for a group with a long operating history, global brands and earnings that have grown 12.2% per year over the past 5 years, even if the most recent twelve months included a large one off loss of ¥5.4b and a step down in profit margins from 6.7% to 4.5%.
The result is a split picture. The market price implies a rich multiple on today’s earnings, yet the DCF work suggests there is still a gap between the current share price and the modelled cash flow value, with TOMY Company forecast to grow earnings by 12.12% per year and revenue by 3.2% per year according to the supplied estimates.
Look into how the SWS DCF model arrives at its fair value.
Result: Preferred multiple of 28.2x (OVERVALUED)
Still, TOMY Company’s premium P/E and the recent one off loss of ¥5.4b leave little room if future cash flows or margins fall short of expectations.
Find out about the key risks to this TOMY Company narrative.
Another view on TOMY Company’s value
On the SWS DCF model, TOMY Company looks undervalued, with the current price of ¥4,046 below an estimated future cash flow value of ¥6,585.29. That clashes with the rich 28.2x P/E and implies the market may be pricing near term wobble more harshly than long term cash potential. Which signal do you trust more?
Look into how the SWS DCF model arrives at its fair value.
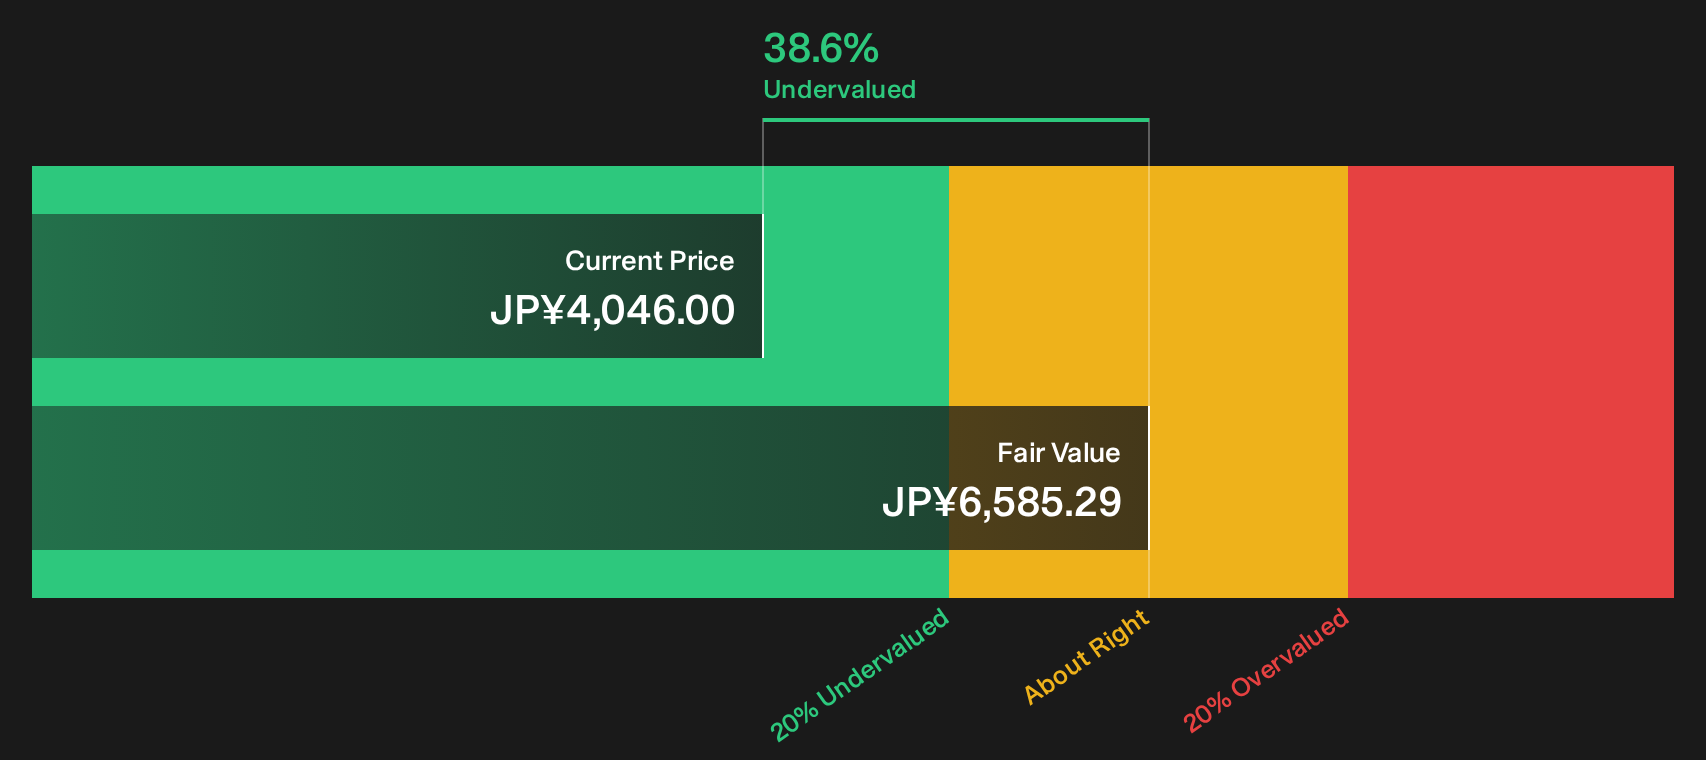
Simply Wall St performs a discounted cash flow (DCF) on every stock in the world every day (check out TOMY Company for example). We show the entire calculation in full. You can track the result in your watchlist or portfolio and be alerted when this changes, or use our stock screener to discover 17 high quality undervalued stocks. If you save a screener we even alert you when new companies match - so you never miss a potential opportunity.
Next Steps
Market sentiment toward TOMY Company appears mixed, with identifiable risks on one side and appealing potential on the other. Consider acting promptly, review the data for yourself and weigh up the 2 key rewards and 2 important warning signs.
Looking for more investment ideas beyond TOMY Company?
Do not stop with TOMY Company. Use the same data driven tools to hunt for fresh opportunities that fit your risk tolerance and return goals.
- Target quality at a discount by scanning companies that pass strict valuation and fundamental filters using the Simply Wall St 17 high quality undervalued stocks.
- Build a portfolio that pays you while you wait by zeroing in on income focused opportunities through the Simply Wall St 15 dividend fortresses.
- Keep risk in check and avoid fragile balance sheets by filtering for resilient businesses using the Simply Wall St 12 resilient stocks with low risk scores.
This article by Simply Wall St is general in nature. We provide commentary based on historical data and analyst forecasts only using an unbiased methodology and our articles are not intended to be financial advice. It does not constitute a recommendation to buy or sell any stock, and does not take account of your objectives, or your financial situation. We aim to bring you long-term focused analysis driven by fundamental data. Note that our analysis may not factor in the latest price-sensitive company announcements or qualitative material. Simply Wall St has no position in any stocks mentioned.
Have feedback on this article? Concerned about the content? Get in touch with us directly. Alternatively, email editorial-team@simplywallst.com