
Discover Evolus And Two Other Growth Companies With Strong Insider Backing
Over the last 7 days, the United States market has experienced a slight decline of 1.1%, yet it has shown a robust growth of 12% over the past year, with earnings forecasted to increase by 17% annually. In this environment, identifying growth companies with strong insider ownership can be crucial as it often indicates confidence from those closest to the business in its potential for future success.
Top 10 Growth Companies With High Insider Ownership In The United States
| Name | Insider Ownership | Earnings Growth |
| Uxin (UXIN) | 34.3% | 69.4% |
| Upstart Holdings (UPST) | 14.2% | 68.4% |
| Standard Nuclear (STDN) | 18.8% | 61.3% |
| Precigen (PGEN) | 11.7% | 55.4% |
| Nu Holdings (NU) | 22.8% | 21.8% |
| Karman Holdings (KRMN) | 14.4% | 56.2% |
| Himax Technologies (HIMX) | 29.2% | 70.2% |
| Dave (DAVE) | 16.9% | 23.6% |
| Carlyle Group (CG) | 27.4% | 22% |
| Almonty Industries (ALM) | 10.8% | 38% |
We're going to check out a few of the best picks from our screener tool.
Evolus (EOLS)
Simply Wall St Growth Rating: ★★★★☆☆
Overview: Evolus, Inc. is a performance beauty company that offers products in the cash-pay aesthetic market across the United States, Canada, Europe, and Australia with a market cap of $528.40 million.
Operations: The company generates revenue of $316.49 million by providing medical aesthetic products to the cash-pay market in regions including the United States, Canada, Europe, and Australia.
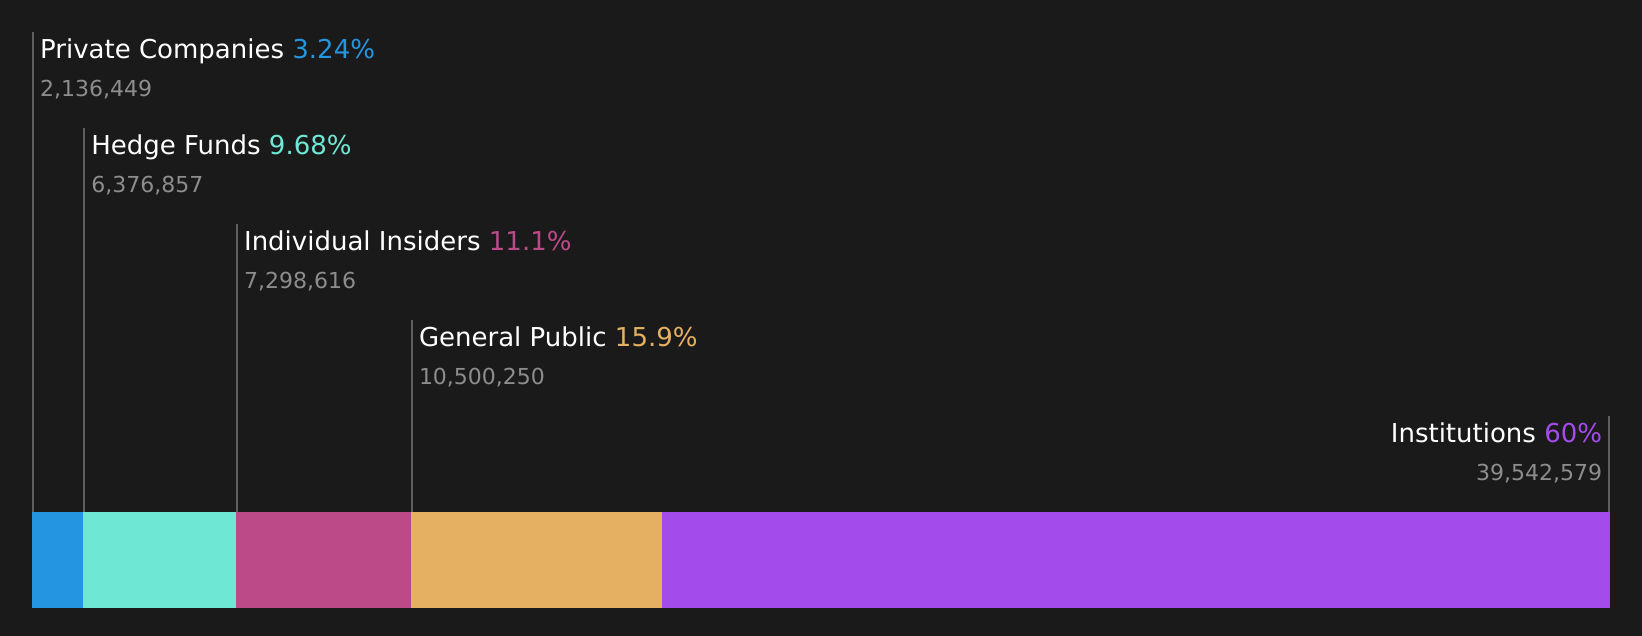
Insider Ownership: 10.9%
Earnings Growth Forecast: 69.8% p.a.
Evolus, Inc. demonstrates growth potential with insider ownership and strategic initiatives. The company's revenue is forecast to grow at 15% annually, surpassing the US market average of 13.3%. Recent expansions include a licensing agreement for Profhilo in the US, enhancing its injectable portfolio. Evolus raised its 2026 earnings guidance to between $330 million and $337 million, reflecting strong performance and strategic investments. Despite negative equity, the company is expected to achieve profitability within three years.
- Take a closer look at Evolus' potential here in our earnings growth report.
- Our comprehensive valuation report raises the possibility that Evolus is priced lower than what may be justified by its financials.
Forbright (FRBT)
Simply Wall St Growth Rating: ★★★★☆☆
Overview: Forbright, Inc., a bank holding company for Forbright Bank, offers a range of financial services to consumers and businesses in the United States with a market cap of $941.68 million.
Operations: Forbright generates revenue from its Banking segment, totaling $325.02 million.
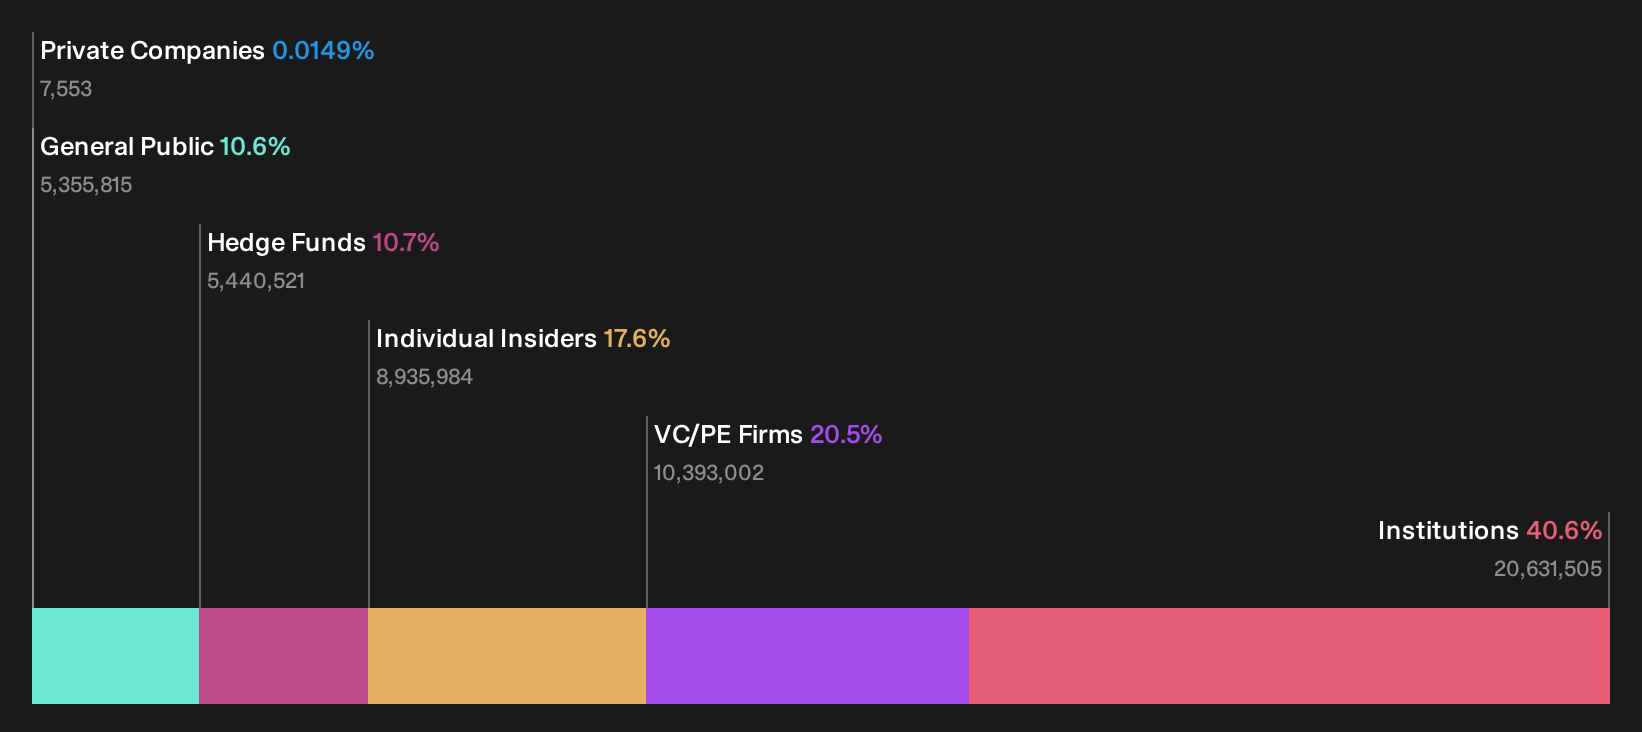
Insider Ownership: 17.6%
Earnings Growth Forecast: 37.6% p.a.
Forbright, Inc. shows promising earnings growth potential, with forecasts indicating a significant 37.6% annual increase, outpacing the US market average of 17.1%. Despite slower revenue growth at 15% annually and a low return on equity forecast of 11.8%, the stock is trading at a substantial discount to its estimated fair value by analysts. Recent earnings reports show net interest income of US$63.15 million for Q2 2026, though net income decreased year-over-year to US$4.12 million due to charge-offs.
- Dive into the specifics of Forbright here with our thorough growth forecast report.
- In light of our recent valuation report, it seems possible that Forbright is trading behind its estimated value.
Ryan Specialty Holdings (RYAN)
Simply Wall St Growth Rating: ★★★★☆☆
Overview: Ryan Specialty Holdings, Inc. is a service provider offering specialty products and solutions to insurance brokers, agents, and carriers across various regions including the United States, Canada, the United Kingdom, Europe, India, Singapore and internationally with a market cap of $10.03 billion.
Operations: The company's revenue comes primarily from its Insurance Brokers segment, which generated $3.16 billion.
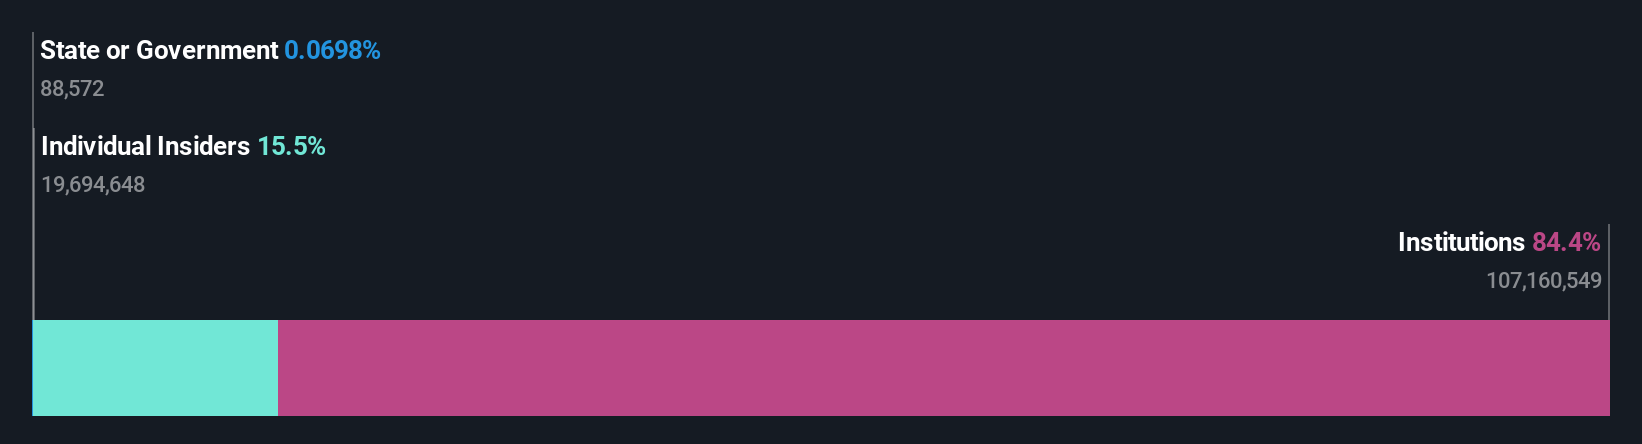
Insider Ownership: 11.7%
Earnings Growth Forecast: 44.8% p.a.
Ryan Specialty Holdings is poised for robust earnings growth, with forecasts suggesting a 44.8% annual increase, significantly outpacing the US market. However, its revenue growth of 7.6% annually lags behind the broader market. Insider transactions show more shares bought than sold recently, though volumes are not substantial. The company remains active in M&A, enhancing its growth profile through strategic acquisitions while maintaining a strong buyback program and consistent dividend payouts of US$0.13 per share quarterly.
- Get an in-depth perspective on Ryan Specialty Holdings' performance by reading our analyst estimates report here.
- Our valuation report here indicates Ryan Specialty Holdings may be overvalued.
Next Steps
- Click this link to deep-dive into the 184 companies within our Fast Growing US Companies With High Insider Ownership screener.
- Interested In Other Possibilities? Outshine the giants: these 17 early-stage AI stocks could fund your retirement.
This article by Simply Wall St is general in nature. We provide commentary based on historical data and analyst forecasts only using an unbiased methodology and our articles are not intended to be financial advice. It does not constitute a recommendation to buy or sell any stock, and does not take account of your objectives, or your financial situation. We aim to bring you long-term focused analysis driven by fundamental data. Note that our analysis may not factor in the latest price-sensitive company announcements or qualitative material. Simply Wall St has no position in any stocks mentioned.The analysis only considers stock directly held by insiders. It does not include indirectly owned stock through other vehicles such as corporate and/or trust entities. All forecast revenue and earnings growth rates quoted are in terms of annualised (per annum) growth rates over 1-3 years.
Have feedback on this article? Concerned about the content? Get in touch with us directly. Alternatively, email editorial-team@simplywallst.com