
Exploring Three Undiscovered Asian Stocks with Solid Potential
Amidst the backdrop of rising oil prices and fluctuating treasury yields, Asian markets have been navigating a complex landscape influenced by geopolitical tensions and inflationary pressures. In this environment, identifying stocks with strong fundamentals and growth potential can offer investors opportunities to diversify their portfolios.
Top 10 Undiscovered Gems With Strong Fundamentals In Asia
| Name | Debt To Equity | Revenue Growth | Earnings Growth | Health Rating |
|---|---|---|---|---|
| Ad-Sol Nissin | NA | 7.22% | 15.60% | ★★★★★★ |
| Chongqing Machinery & Electric | 18.92% | 8.39% | 25.87% | ★★★★★★ |
| Taiyo KagakuLtd | 0.68% | 6.49% | 11.88% | ★★★★★★ |
| SPRIX | 13.12% | 6.95% | -5.71% | ★★★★★★ |
| AMPAK Technology | 34.99% | -10.73% | -19.52% | ★★★★★☆ |
| Forth Smart Service | 44.85% | -3.80% | 10.19% | ★★★★★☆ |
| Sing Investments & Finance | 0.10% | 5.85% | 7.00% | ★★★★☆☆ |
| Shengda ResourcesLtd | 57.58% | 8.61% | 9.90% | ★★★☆☆☆ |
| Primo Global Holdings | 70.93% | 9.87% | 28.79% | ★★★☆☆☆ |
| HANA Micron | 137.37% | 21.15% | 26.62% | ★★★☆☆☆ |
Let's review some notable picks from our screened stocks.
Shandong Bailong Chuangyuan Bio-Tech (SHSE:605016)
Simply Wall St Value Rating: ★★★★★☆
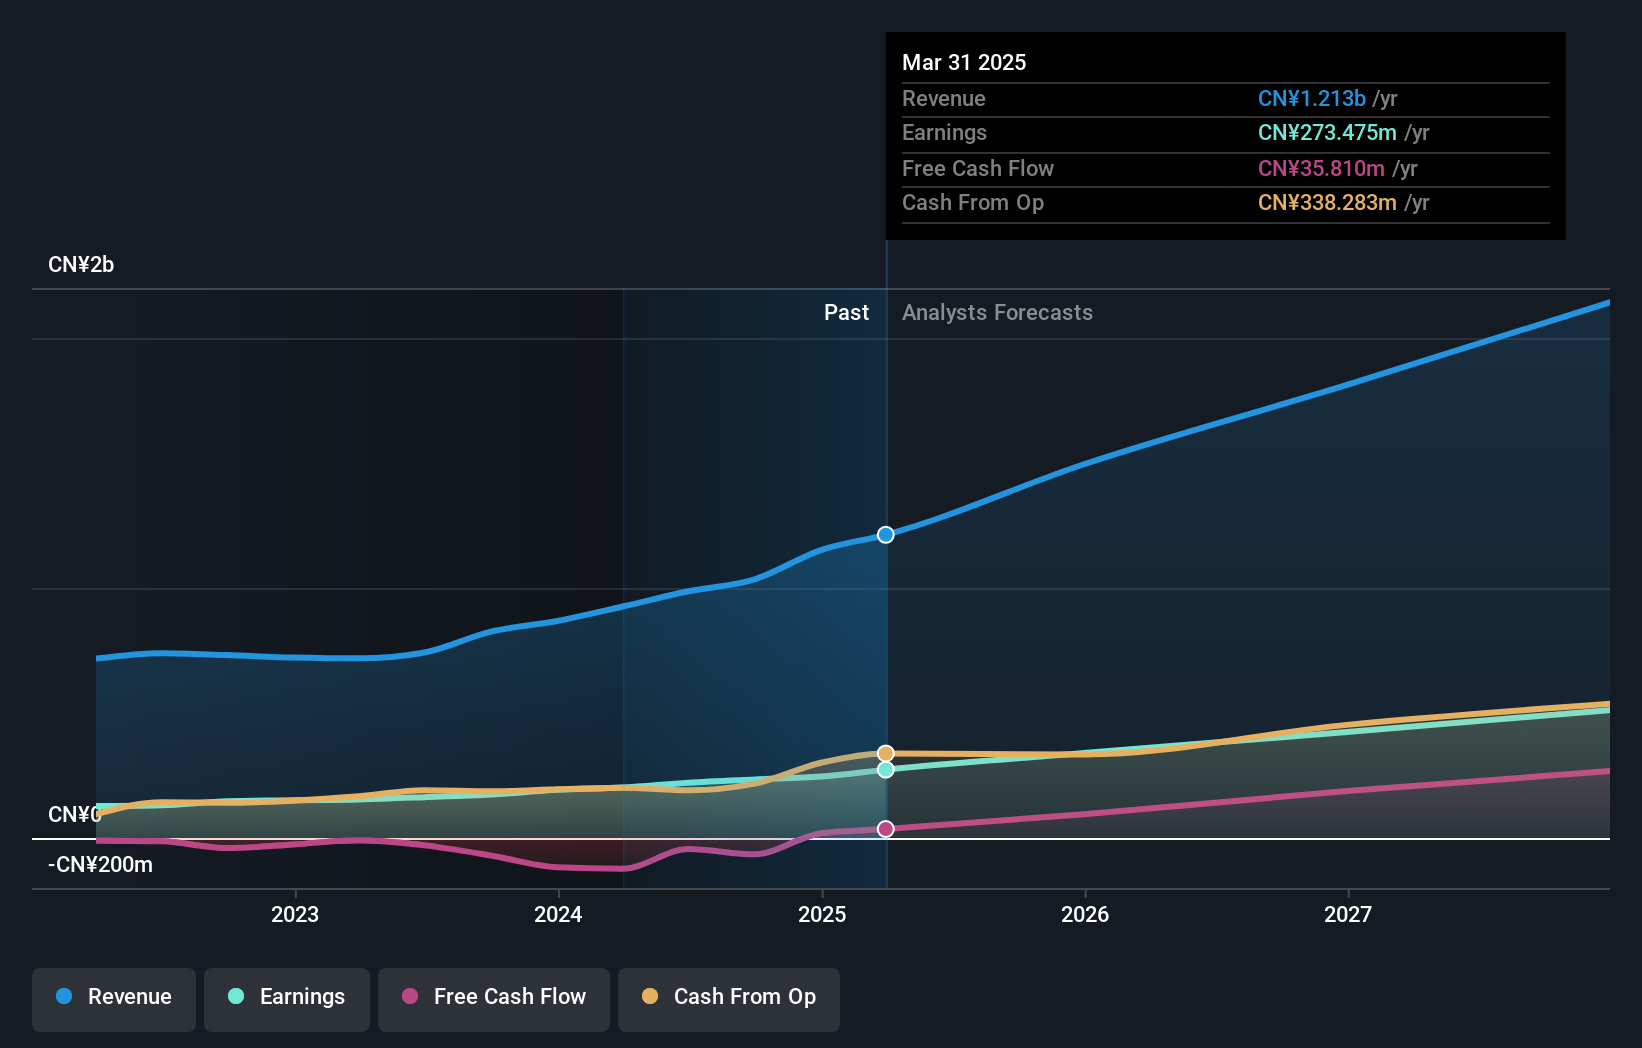
Overview: Shandong Bailong Chuangyuan Bio-Tech Co., Ltd. operates in the biotechnology sector with a market capitalization of CN¥8.74 billion.
Operations: Shandong Bailong Chuangyuan Bio-Tech generates revenue primarily from its biotechnology operations. The company has a market capitalization of CN¥8.74 billion, reflecting its position in the industry.
Shandong Bailong Chuangyuan Bio-Tech has shown promising growth, with earnings rising 38% over the past year, outpacing the food industry's -7%. The company reported sales of CNY 759.46 million for H1 2026, up from CNY 649.19 million a year ago, and net income increased to CNY 210.64 million from CNY 169.78 million. Despite an increase in its debt-to-equity ratio from 3.7 to 21.4 over five years, it maintains more cash than total debt and trades at a good value compared to peers, suggesting potential for future growth amidst industry challenges.
Shenzhen Uniconn Technology (SZSE:301631)
Simply Wall St Value Rating: ★★★★★★
Overview: Shenzhen Uniconn Technology Co., Ltd. specializes in the research, design, production, sale, and service of electrical connection components in China and has a market capitalization of approximately CN¥7.76 billion.
Operations: The company generates revenue primarily from its electrical connection components segment, totaling approximately CN¥5.98 billion.
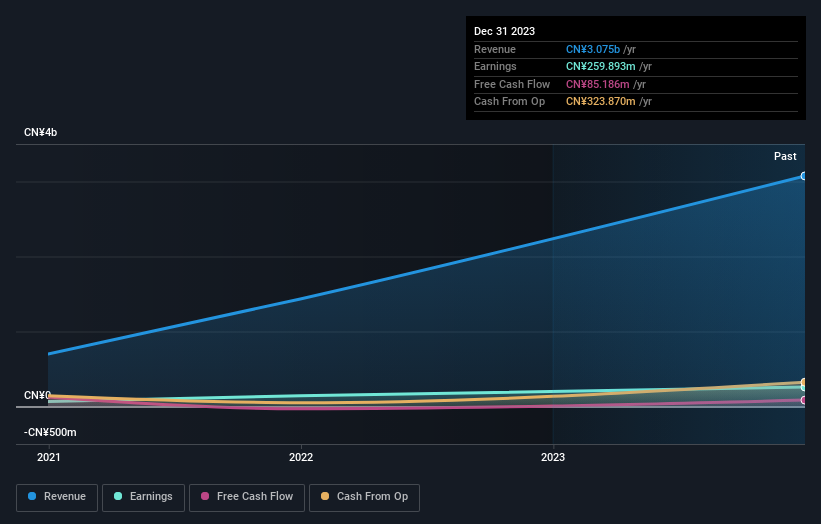
Shenzhen Uniconn Technology, a promising entity in the electronics sector, showcases impressive financial health with earnings growth of 12.4% over the past year, surpassing industry averages. The company trades at 55.1% below its estimated fair value and has reduced its debt to equity ratio from 22.3% to 6.4% over five years, indicating prudent financial management. Recent earnings reports reveal sales of CNY 2,875 million for the first half of 2026 compared to CNY 2,057 million last year; however, net income dipped slightly from CNY 136 million to CNY 129 million. Board changes and amendments in bylaws were also noted recently.
Japan Eyewear Holdings (TSE:5889)
Simply Wall St Value Rating: ★★★☆☆☆
Overview: Japan Eyewear Holdings Co., Ltd. operates in Japan through its subsidiaries by planning, designing, manufacturing, and selling eyeglasses, with a market cap of ¥55.06 billion.
Operations: Japan Eyewear Holdings generates revenue primarily from its subsidiaries, Four Nines and Kaneko Optical, with ¥6.31 billion and ¥13.65 billion respectively.
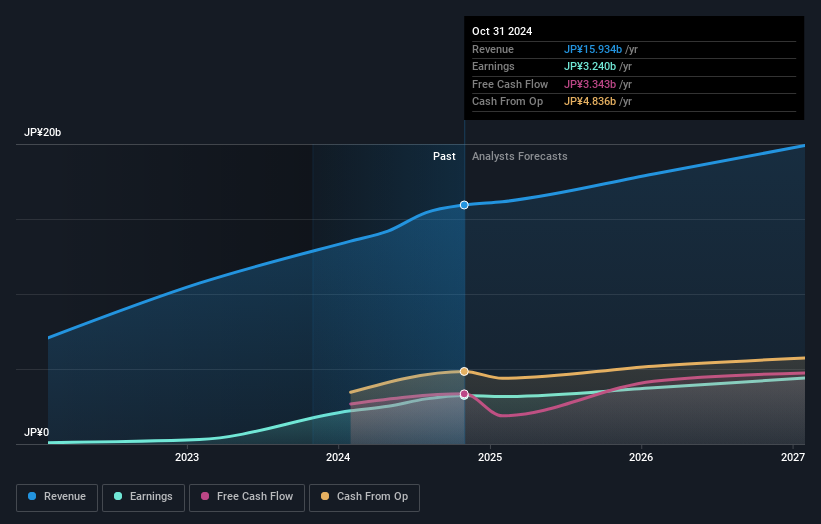
Japan Eyewear Holdings, a promising player in the eyewear market, showcases robust financial health with earnings growing 34% annually over the past five years. Despite a high net debt to equity ratio of 41%, its interest payments are well covered by EBIT at 17.9 times. The company trades at nearly 55% below its estimated fair value, suggesting potential undervaluation. Recent half-year results highlight sales growth from JPY 8.94 billion to JPY 10.26 billion and net income rising from JPY 1.74 billion to JPY 2.24 billion, reflecting solid performance and strategic dividend increases funded by retained earnings for future expansion plans.
Seize The Opportunity
- Gain an insight into the universe of 118 Asian Undiscovered Gems With Strong Fundamentals by clicking here.
- Invested in any of these stocks? Simplify your portfolio management with Simply Wall St and stay ahead with our alerts for any critical updates on your stocks.
- Simply Wall St is your key to unlocking global market trends, a free user-friendly app for forward-thinking investors.
Curious About Other Options?
- Explore high-performing small cap companies that haven't yet garnered significant analyst attention.
- Fuel your portfolio with companies showing strong growth potential, backed by optimistic outlooks both from analysts and management.
- Find companies with promising cash flow potential yet trading below their fair value.
This article by Simply Wall St is general in nature. We provide commentary based on historical data and analyst forecasts only using an unbiased methodology and our articles are not intended to be financial advice. It does not constitute a recommendation to buy or sell any stock, and does not take account of your objectives, or your financial situation. We aim to bring you long-term focused analysis driven by fundamental data. Note that our analysis may not factor in the latest price-sensitive company announcements or qualitative material. Simply Wall St has no position in any stocks mentioned.
Have feedback on this article? Concerned about the content? Get in touch with us directly. Alternatively, email editorial-team@simplywallst.com