
Ameren (AEE) Debt Deal And Investor Update Leave Valuation In Focus
Ameren (AEE) has been active on two fronts, locking in a long dated fixed income deal and speaking to investors at Barclays 40th Annual Energy Power Conference in New York.
Recent trading has been choppy for Ameren, with the share price down 5.26% over the past 30 days and 4.39% over 90 days. Yet the year to date share price return of 3.01%, alongside a 1 year total shareholder return of 8.31%, points to steady, income led momentum built over several years, including a 5 year total shareholder return of 44.52%.
Spot emerging utilities that combine income potential with balance sheet strength by scanning our hand picked 37 power grid technology and infrastructure stocks.That recent pullback in Ameren can read either as investors cooling on the story or as noise against a still solid utility footprint. How does that balance show up in the current valuation work up?
Most Popular Narrative: 13% Undervalued
Against Ameren's last close of $103.90, the most followed narrative points to a fair value of about $119.87. This frames the recent pullback as a gap between price and underlying thesis rather than a verdict on the utility's fundamentals.
Ongoing and future investments in grid modernization, resilience (e.g., smart substations, composite poles, automation), and clean energy resources (wind, solar, batteries) are expected to expand Ameren's regulated rate base at a forecasted 9.2% CAGR, enabling higher allowed returns and improved net margins.
See why 3 investors see Ameren as 13% undervalued.
Result: Fair Value of $119.87 (UNDERVALUED)
Still, Ameren’s story leans heavily on data center load ramping as planned and on continued regulatory and tax credit support, both of which could slip or be revised.
Find out about the key risks to this Ameren narrative.
Another View: Ameren Through A Cash Flow Lens
The analyst narrative around Ameren leans on earnings, grids and data center demand. A different tool, the SWS DCF model, paints a more cautious picture. On that measure, Ameren at $103.90 sits above an estimated future cash flow value of $95.28, which screens as overvalued rather than discounted.
Both approaches rest on long term assumptions about regulation, capital spend and load growth. The big question for investors is which story feels more realistic when conditions inevitably change.
Look into how the SWS DCF model arrives at its fair value.
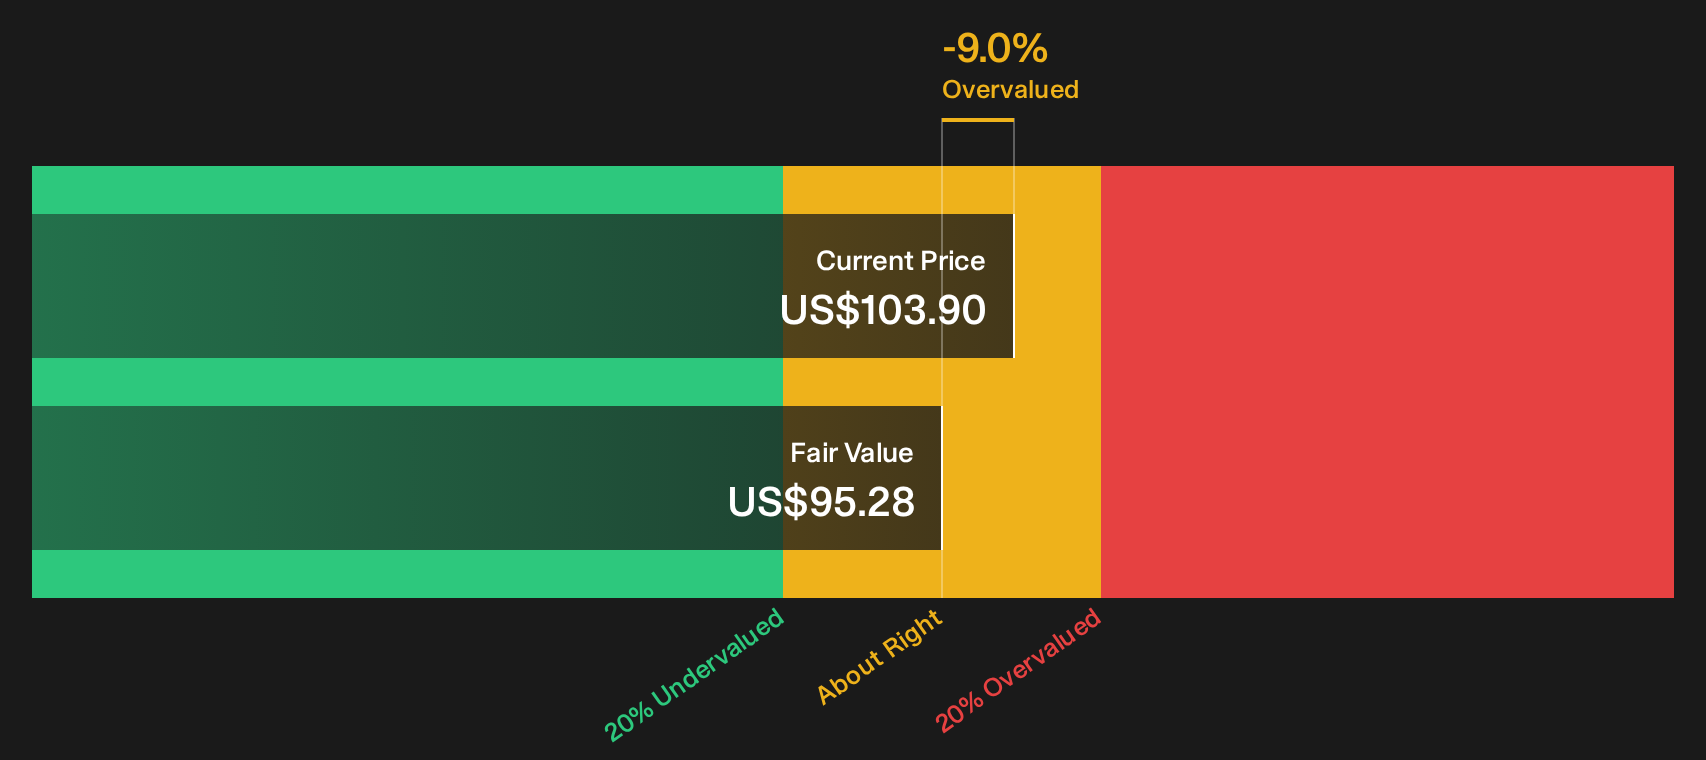
Simply Wall St performs a discounted cash flow (DCF) on every stock in the world every day (check out Ameren for example). We show the entire calculation in full. You can track the result in your watchlist or portfolio and be alerted when this changes, or use our stock screener to discover 29 high quality undervalued stocks. If you save a screener we even alert you when new companies match - so you never miss a potential opportunity.
Next Steps
Mixed messages on Ameren's value story can be hard to read. Move quickly, review the full data set, and weigh both sides of the argument with 3 key rewards and 2 important warning signs
Looking for more Ameren style investment ideas?
If Ameren has sharpened your focus on quality opportunities, use Simply Wall Street's screener to surface fresh ideas that fit your own risk and return preferences.
- Target resilient income by scanning a curated set of 6 dividend fortresses that aim to pair higher yields with business durability.
- Hunt for potential mispricings by running your filters across 29 high quality undervalued stocks that combine fundamentals with attractive valuations.
- Protect the downside by zeroing in on 11 resilient stocks with low risk scores that rate well on financial strength and earnings stability.
This article by Simply Wall St is general in nature. We provide commentary based on historical data and analyst forecasts only using an unbiased methodology and our articles are not intended to be financial advice. It does not constitute a recommendation to buy or sell any stock, and does not take account of your objectives, or your financial situation. We aim to bring you long-term focused analysis driven by fundamental data. Note that our analysis may not factor in the latest price-sensitive company announcements or qualitative material. Simply Wall St has no position in any stocks mentioned.
Have feedback on this article? Concerned about the content? Get in touch with us directly. Alternatively, email editorial-team@simplywallst.com