
Barrick Mining (B) Climbed, But What Is Drawing Fresh Attention?
Barrick Mining (NYSE:B) has drawn fresh attention after its recent rebrand from Barrick Gold Corporation. The shift highlights its broader focus on gold, copper, silver, and energy materials across multiple large producing assets.
Recent trading has been firm rather than explosive. Barrick Mining’s share price has climbed over the past quarter, with an 8.30% 90 day share price return and a 48.33% 1 year total shareholder return, which may point to building momentum as the rebrand reframes how investors view its long term potential.
Scan Barrick Mining’s peers that are riding similar momentum across gold and copper by checking our hand picked list of 36 elite gold producer stocks.
Barrick Mining now trades close to analyst targets, yet its own intrinsic value estimate points to a wider gap. Does fair value lean closer to the US$46 consensus or to the deeper 27% discount signal?
Price-to-Earnings of 11x: Is it justified?
Barrick Mining trades on a P/E of 11x, alongside a $43.69 share price that screens as inexpensive against both the wider US market and metals and mining peers.
The P/E ratio compares what investors pay today for each dollar of earnings. For a diversified producer like Barrick Mining with established assets and positive net income, it provides a quick sense of how generously or cautiously the market is pricing current profitability.
At 11x, the stock changes hands at a clear discount to the US market on 18.2x and to the US metals and mining industry on 20.2x. The gap is even wider against an estimated fair P/E of 22x. This indicates the valuation level could change materially if sentiment or earnings expectations move closer to that fair ratio anchor.
Explore the SWS fair ratio for Barrick Mining.
Result: Price-to-Earnings of 11x (UNDERVALUED)
Still, the Barrick Mining story carries clear risks, including potential setbacks at key mines like Carlin or Pueblo Viejo, as well as any reversal in recent earnings growth.
Find out about the key risks to this Barrick Mining narrative.
Another view on Barrick Mining’s value
The earlier P/E workup painted Barrick Mining as inexpensive, yet the SWS DCF model points in the other direction. On that cash flow view, the shares at $43.69 sit above an estimated value of $34.32, which flags the stock as overvalued based on those long term assumptions. That split raises a simple question. Which signal do you trust more: today’s earnings multiple, or a future cash flow roadmap?
Look into how the SWS DCF model arrives at its fair value.
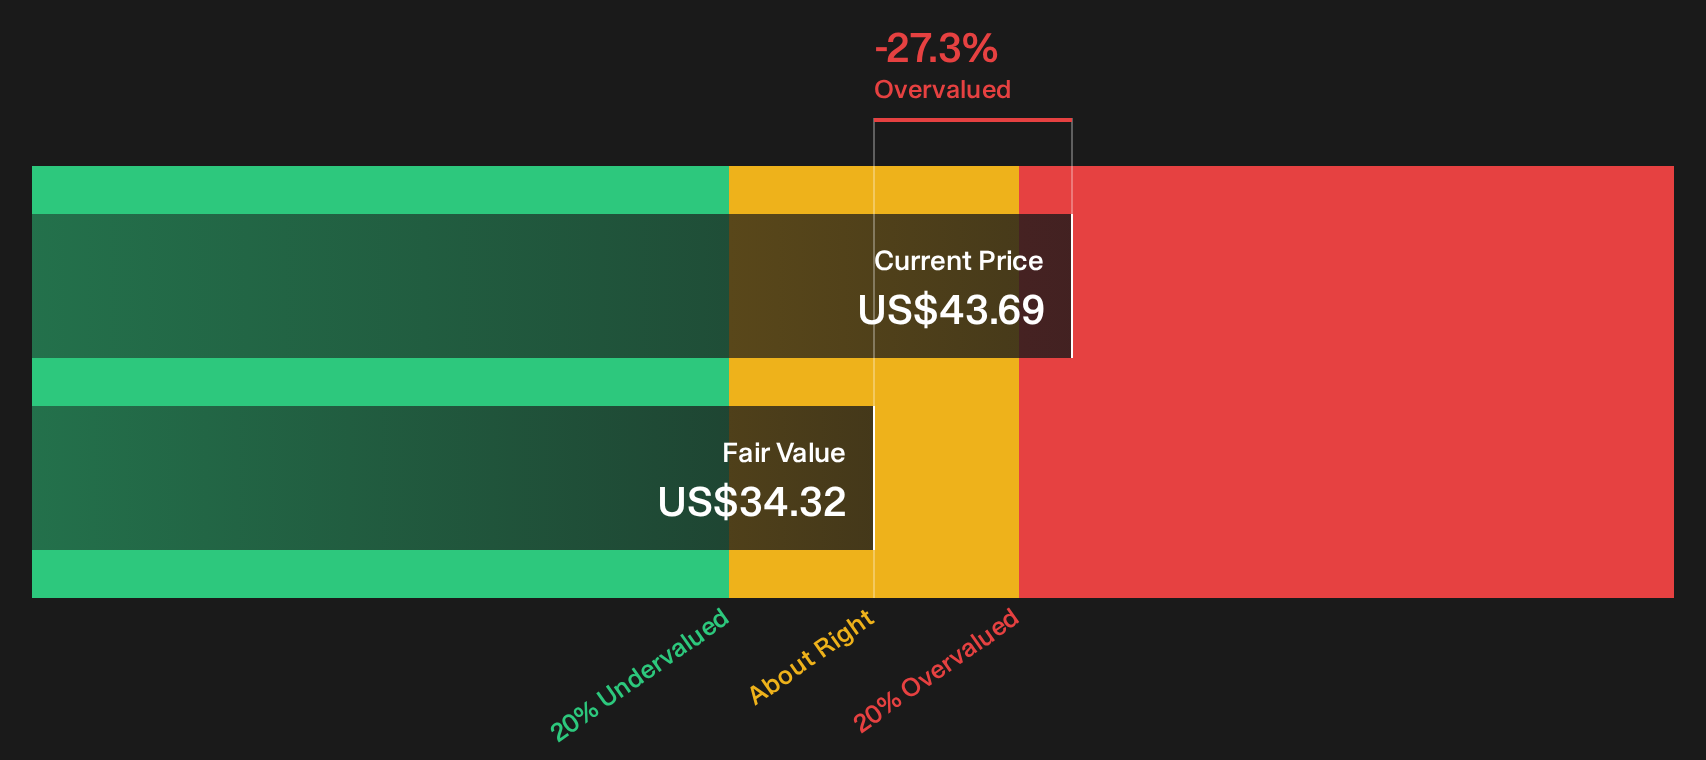
Simply Wall St performs a discounted cash flow (DCF) on every stock in the world every day (check out Barrick Mining for example). We show the entire calculation in full. You can track the result in your watchlist or portfolio and be alerted when this changes, or use our stock screener to discover 29 high quality undervalued stocks. If you save a screener we even alert you when new companies match - so you never miss a potential opportunity.
Next Steps
Mixed messages so far, right. If Barrick Mining looks interesting, act promptly, evaluate the assumptions that matter to you, and consider its 4 key rewards and 2 important warning signs.
Hunting for more Barrick Mining style ideas?
If Barrick Mining has caught your eye, do not stop with just one ticker. Broaden your watchlist now so you are not late to the next opportunity.
- Target resilient income by scanning companies in the 6 dividend fortresses that combine higher yields with support from their current financial profiles.
- Spot potential bargains early by reviewing the 29 high quality undervalued stocks that pair stronger balance sheets with pricing that screens as comparatively low.
- Uncover fresh opportunities before the crowd by checking the 16 high quality undiscovered gems that share solid fundamentals but attract less day to day attention.
This article by Simply Wall St is general in nature. We provide commentary based on historical data and analyst forecasts only using an unbiased methodology and our articles are not intended to be financial advice. It does not constitute a recommendation to buy or sell any stock, and does not take account of your objectives, or your financial situation. We aim to bring you long-term focused analysis driven by fundamental data. Note that our analysis may not factor in the latest price-sensitive company announcements or qualitative material. Simply Wall St has no position in any stocks mentioned.
Have feedback on this article? Concerned about the content? Get in touch with us directly. Alternatively, email editorial-team@simplywallst.com