
Saul Centers (BFS) Holds Its Dividend, Is The Valuation Case Still Compelling?
Dividend decisions in focus
Saul Centers (BFS) has affirmed a quarterly common dividend of $0.59 per share, with payment set for October 30, 2026. This keeps the payout level unchanged versus both the prior quarter and last year’s comparable period.
Saul Centers shares trade at $30.31, with the 30-day share price return down 10.88% and the 90-day share price return down 15.88%. The 1-year total shareholder return of 0.62% suggests recent weakness has come after a relatively flat longer run.
Scan beyond Saul Centers and see how other income-focused real estate stocks are holding up in our hand-picked 6 dividend fortresses.
After a double digit slide over the past quarter, Saul Centers now offers a higher yield and a lower entry price. Does that reset tilt the risk reward balance toward buyers, or does it signal value traps ahead?
Preferred P/E of 31.7x for Saul Centers: Is it justified?
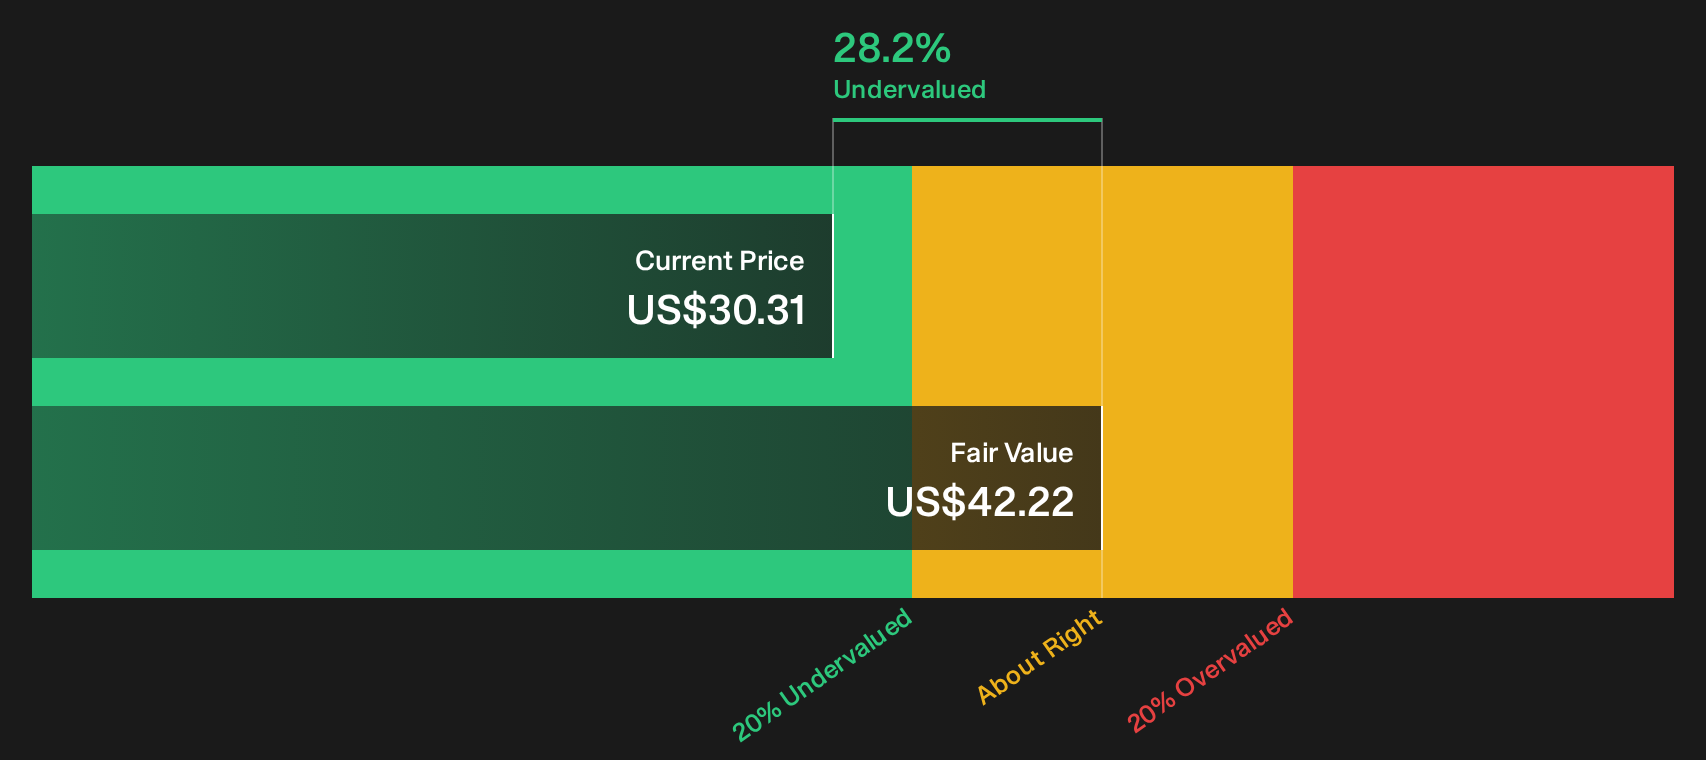
On valuation, Saul Centers trades on a P/E of 31.7x while the share price sits at $30.31, and that multiple comes alongside a 7.79% dividend yield and a share price that is 28.2% below an internal fair value estimate based on future cash flows. For an income oriented REIT, that mix of a relatively rich earnings multiple and a discounted cash flow valuation sends a mixed message that income investors need to unpack.
The P/E ratio compares the current share price with earnings per share and, for real estate trusts like Saul Centers, it offers a shorthand view of how much investors are currently willing to pay for each dollar of profit. A 31.7x P/E, by the supplied data, sits above both the 21x peer average set of comparable companies and the 26.4x seen across the wider US Retail REITs industry, even though earnings have declined 5.2% per year over the past five years and fell 25.8% over the last year.
That setup suggests the market is still assigning a premium to Saul Centers despite weaker recent profit trends, lower net margins at 7.8% versus 11.5% a year earlier, and interest payments that are not well covered by earnings. When a REIT carries a higher P/E than peers while also reporting declining earnings and lower profitability, the valuation can reflect confidence that cash flows and occupancy from its portfolio will support the dividend and future profits, but it also leaves less room for error if those expectations do not play out.
Compared with the US Retail REITs industry, Saul Centers trades on a clearly more expensive P/E multiple, since 31.7x sits materially above the 26.4x industry average and the 21x peer average noted in the data. The SWS DCF model points in a different direction, with an estimate of future cash flow value at $42.22 per share versus the current $30.31 price, so the cash flow based approach indicates undervaluation while the earnings multiple implies investors are already paying up relative to sector norms.
See what the numbers say about this price — find out in our valuation breakdown.
Result: Price-to-earnings of 31.7x (OVERVALUED)
Still, the recent 3 month share price slide and interest costs that are not well covered by earnings leave Saul Centers exposed if cash flow expectations disappoint.
Find out about the key risks to this Saul Centers narrative.
Another view on Saul Centers valuation
The earnings multiple paints Saul Centers as expensive, yet the SWS DCF model points the other way. On that cash flow view, an estimated fair value of $42.22 per share versus a $30.31 price suggests the stock is undervalued, even as recent earnings trends and return metrics keep questions alive.
For readers who want to see how that cash flow estimate is built line by line, Look into how the SWS DCF model arrives at its fair value.
Simply Wall St performs a discounted cash flow (DCF) on every stock in the world every day (check out Saul Centers for example). We show the entire calculation in full. You can track the result in your watchlist or portfolio and be alerted when this changes, or use our stock screener to discover 29 high quality undervalued stocks. If you save a screener we even alert you when new companies match - so you never miss a potential opportunity.
Next Steps
Mixed signals around Saul Centers valuation and income profile can feel messy, so move quickly, review the numbers directly, then weigh the 2 key rewards and 3 important warning signs.
Looking for more investment ideas beyond Saul Centers?
If Saul Centers has you rethinking income and value, do not stop here. Use the screener tools to pressure test fresh ideas before capital moves.
- Target quality at a discount by reviewing companies on our 29 high quality undervalued stocks and see which stocks the data suggests may trade below their fundamentals.
- Strengthen your downside protection by scanning the 30 resilient stocks with low risk scores focused on businesses with more resilient risk scores and steadier financial profiles.
- Get ahead of the crowd by checking the 16 high quality undiscovered gems and spot fundamentally strong opportunities that fewer investors are watching.
This article by Simply Wall St is general in nature. We provide commentary based on historical data and analyst forecasts only using an unbiased methodology and our articles are not intended to be financial advice. It does not constitute a recommendation to buy or sell any stock, and does not take account of your objectives, or your financial situation. We aim to bring you long-term focused analysis driven by fundamental data. Note that our analysis may not factor in the latest price-sensitive company announcements or qualitative material. Simply Wall St has no position in any stocks mentioned.
Have feedback on this article? Concerned about the content? Get in touch with us directly. Alternatively, email editorial-team@simplywallst.com