
SMS (TSE:2175) Faces Activist Pressure, Is It Still Undervalued?
Oasis Management has opened an activist dialogue with SMS (TSE:2175) after outlining proposals on asset moves, AI use, pricing, governance and board reshuffling that could reshape how the healthcare information group is run.
Recent trading has been strong, with SMS’s share price delivering a 19.34% 1 month return and 32.51% 3 month share price return. This has contributed to a 98.37% year to date gain, while the 1 year total shareholder return of 69.67% signals powerful but relatively recent momentum building around the stock.
Scan how activism and AI themes are playing out beyond SMS by reviewing the hand-picked 74 high quality undiscovered gems that currently sit under heavier institutional scrutiny.
The chart shows SMS has been on a tear. The debate is whether that surge reflects a healthier information platform or a rush of optimism around activism and AI. It is time to see what the valuation is actually pricing in.
Preferred Price-to-Sales Multiple of 3.3x for SMS: Is it justified?
Valuation has raced to catch up with the excitement around SMS, with the shares at ¥2,678 and the stock trading on a P/S of 3.3x while still reporting a loss of ¥14,529 in its latest year.
P/S looks at what investors are willing to pay for each ¥1 of revenue, which often matters more than earnings for businesses that are still loss making or investing heavily. For SMS, that lens is important because the group generated ¥66,275 of revenue and is currently unprofitable, so earnings based metrics do not tell much about how the market is assessing the healthcare information platform.
On raw comparison, the market is assigning a rich tag to this ticker. The P/S of 3.3x is described as expensive versus both the JP Professional Services industry average of 0.9x and a peer average of 2.5x. This suggests investors are paying a premium relative to similar companies. At the same time, this ratio is below the estimated fair P/S of 4.5x, a level the market could potentially move toward if revenue forecasts near 9.9% a year and expectations around future profitability and a forecast return on equity of 23.7% in three years hold up.
Explore the SWS fair ratio for SMS.
Result: Price-to-Sales of 3.3x (ABOUT RIGHT)
Still, SMS faces clear risk if activism loses steam or if AI initiatives fail to translate its ¥66,275 of revenue and current loss into convincing progress.
Find out about the key risks to this SMS narrative.
Another View on SMS Using the SWS DCF Model
The multiple based read on SMS paints one picture. The SWS DCF model tells you something different. At ¥2,678 the stock sits about 19.7% below an estimated future cash flow value of roughly ¥3,336. This points to a possible cushion in the price, but only if those cash flow assumptions hold up.
Before relying on that gap, it helps to understand how that cash flow curve is built and what would need to go right for SMS to close it. Look into how the SWS DCF model arrives at its fair value.
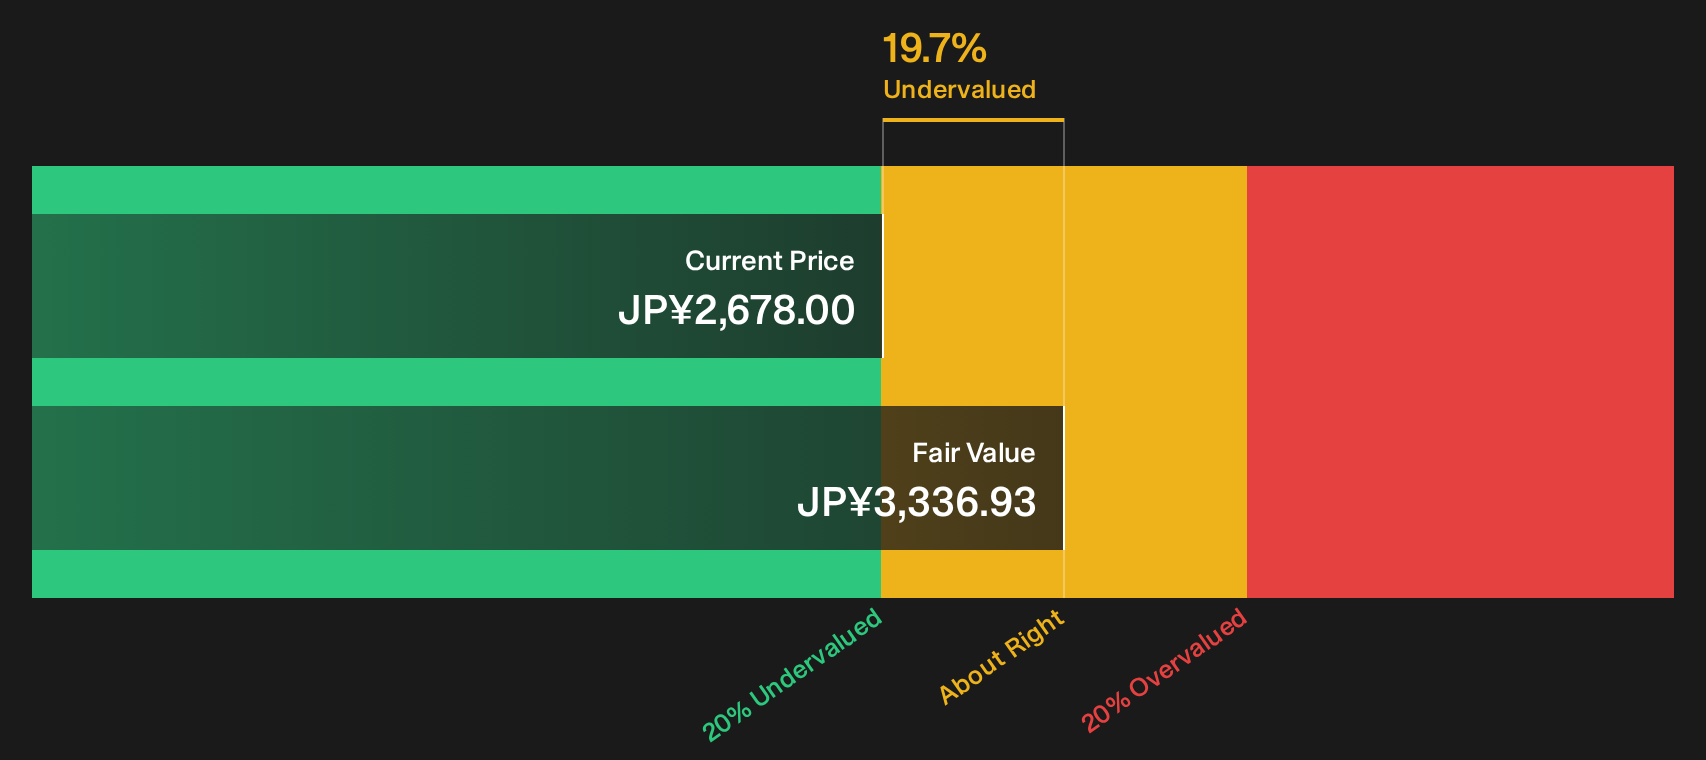
Simply Wall St performs a discounted cash flow (DCF) on every stock in the world every day (check out SMS for example). We show the entire calculation in full. You can track the result in your watchlist or portfolio and be alerted when this changes, or use our stock screener to discover 17 high quality undervalued stocks. If you save a screener we even alert you when new companies match - so you never miss a potential opportunity.
Next Steps
Momentum around SMS may appear exciting to some readers and stretched to others. Move quickly, examine the forecasts in detail, and weigh the potential upside against the risks by reviewing the 2 key rewards.
Looking for more SMS investment ideas beyond this stock?
If SMS has your attention, do not stop here. Use the broader opportunity set to pressure test your thinking and keep your watchlist one step ahead.
- Target potential value plays before they move by scanning companies on our 17 high quality undervalued stocks.
- Prioritize resilience by reviewing a list of solid balance sheet and fundamentals (20 results) that may better handle tougher conditions.
- Hunt for under the radar opportunities that institutions are starting to notice by checking the 74 high quality undiscovered gems.
This article by Simply Wall St is general in nature. We provide commentary based on historical data and analyst forecasts only using an unbiased methodology and our articles are not intended to be financial advice. It does not constitute a recommendation to buy or sell any stock, and does not take account of your objectives, or your financial situation. We aim to bring you long-term focused analysis driven by fundamental data. Note that our analysis may not factor in the latest price-sensitive company announcements or qualitative material. Simply Wall St has no position in any stocks mentioned.
Have feedback on this article? Concerned about the content? Get in touch with us directly. Alternatively, email editorial-team@simplywallst.com