
TMX Group (TSX:X) Stock May Trade At A Premium After $1.1b Debt Offering
TMX Group has delivered a strong multi year share price performance, and the question now is whether that move is fully backed by the earnings that support today’s valuation.
- Over the past 5 years, TMX Group has returned 114.1%. This puts real weight on whether the current earnings base can carry that kind of share price progress.
- The recent pricing of a C$1.1b senior unsecured debenture offering may reshape the firm’s capital structure. This can influence future interest costs and the portion of earnings available to equity holders.
- Your read on TMX Group is one view; the desks covering it have another. See what analysts think TMX Group's shares could be worth.
The stock’s next move may depend on whether TMX Group’s current price is well supported by the earnings investors are paying for today.
If you are considering TMX Group at C$53.11 based on its earnings profile, it can help to compare it to 3 high quality undervalued stocks for a broader perspective.
Is TMX Group Getting Expensive on Earnings?
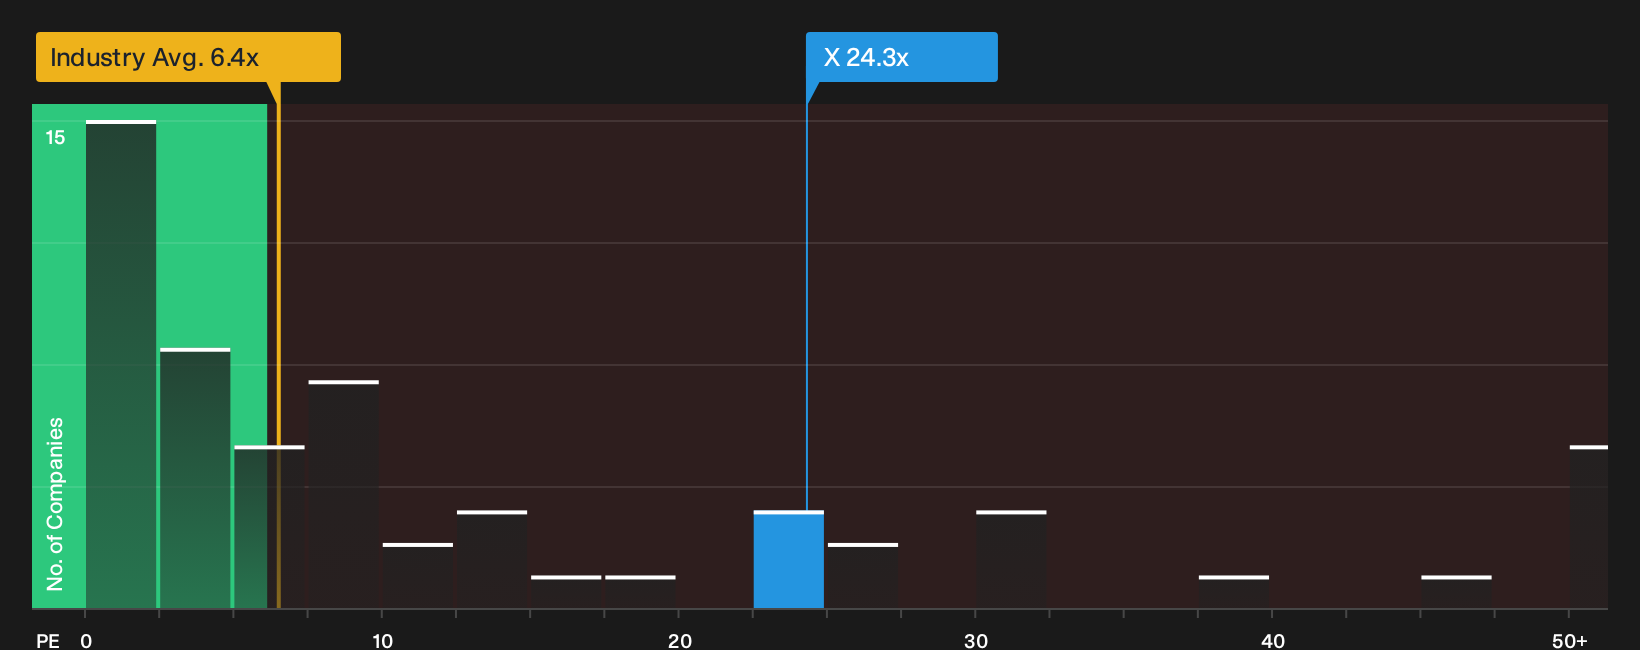
The P/E ratio is a relevant measure for TMX Group because earnings are a core reference point for most exchange operators. On this basis, the stock trades on about 24.3x earnings, compared with roughly 6.4x for the wider capital markets sector and around 18.1x for closer peers. That represents a clear premium to both the broad industry and similar businesses.
Because the recent debenture issue and acquisitions have raised expectations around TMX Group, the current P/E also sits above the level suggested by a more tailored fair multiple that accounts for its profitability profile and risk. This indicates that the shares screen as overvalued on earnings today. Any investor considering TMX Group therefore has to evaluate whether its business mix and balance sheet changes justify that higher valuation relative to other capital markets stocks. Explore the numbers behind TMX Group's P/E valuation.
The TMX Group Narrative: What Would Justify Today's Price?
TMX Group’s recent share price run raises a simple question for you as an investor. What would need to happen with its revenue mix, profit margins, and earnings power for today’s valuation to look too low or too rich in hindsight. Simply Wall St Narratives on the Community page set out those kinds of futures in plain terms, with each one tying an implied value to a specific mix of catalysts and risks so you can see which storyline is tracking reality over time.
Community views on TMX Group are split between those who see more upside left in the story and those who think expectations already look full.
Bull case: 18% undervalued
"The ongoing globalization of TMX's business through acquisitions, international listings, and cross-selling data or analytics solutions in Europe and North America is diversifying revenues beyond Canadian equities..."
Discover why this Narrative puts TMX Group at 18% undervalued.
Bear case: 6% overvalued
"TMX’s competitive advantages are well established and unlikely to erode quickly, resting on network effects, regulatory barriers, and embedded data platforms..."
Explore why this Narrative puts TMX Group at 6% overvalued.
TMX Group’s valuation still leaves one big unknown on the table
Price multiples tell you what investors are paying today, but they do not show where the sell side thinks TMX Group could be a few years from now or how that view lines up with your own expectations. Explore where analysts expect TMX Group to be in a few years.
This article by Simply Wall St is general in nature. We provide commentary based on historical data and analyst forecasts only using an unbiased methodology and our articles are not intended to be financial advice. It does not constitute a recommendation to buy or sell any stock, and does not take account of your objectives, or your financial situation. We aim to bring you long-term focused analysis driven by fundamental data. Note that our analysis may not factor in the latest price-sensitive company announcements or qualitative material. Simply Wall St has no position in any stocks mentioned.
Have feedback on this article? Concerned about the content? Get in touch with us directly. Alternatively, email editorial-team@simplywallst.com