
Cui Dongshu: Retail sales of 1.01 million new energy passenger vehicles in August were at a recent medium to high level, and the month-on-month recovery from July was lower than historical performance
The Zhitong Finance App learned that Cui Dongshu released an analysis of the NEV regional market for August 2026. The retail level of 1.01 million vehicles in the NEV passenger car market in August was at a recent medium to high level. Retail sales rebounded 60,000 units month-on-month, and the month-on-month recovery from July was lower than historical performance. Due to the complex influence of market factors, the “low front and high” characteristics of annual sales in recent years are quite obvious. The current trend is relatively stable and better than the 2024 no-trade-in policy trend.
Affected by policy adjustments and poor consumption in 2026, the domestic NEV market showed a relatively weak trend. Private consumption was weaker than the unit car market, private NEV purchases were divided, and the growth of the low-tier regional market was also under great pressure. The main driving force for the growth of the car market was supposed to be the growth of the new energy market in small towns, counties, and villages, but in 2026, the regional market did not show growth performance for entry-level cars or low-tier cars, so the car market is temporarily sluggish.
1. New energy vehicle retail trend in August 2026
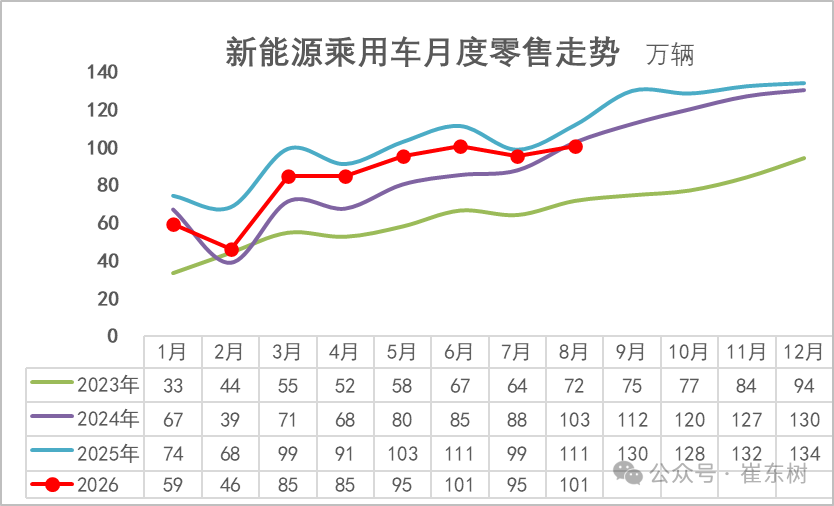
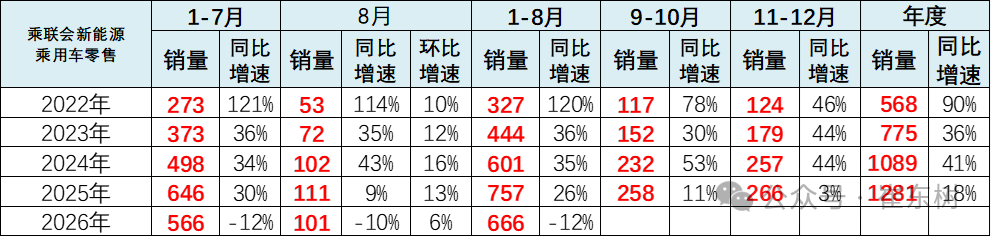
In August, the NEV passenger car market retailed 1.01 million vehicles, down 9.8% year on year and up 5.7% month on month; in January-August, the NEV passenger car market retailed 6.665 million vehicles, down 12.0% year on year. Domestic demand for new energy sources in China, driven by early tax exemption and subsidy policies, is still working well, but the market still lacked vitality before the new battery regulations in August, and the month-on-month retail trend in August was slower than the overall passenger car trend.
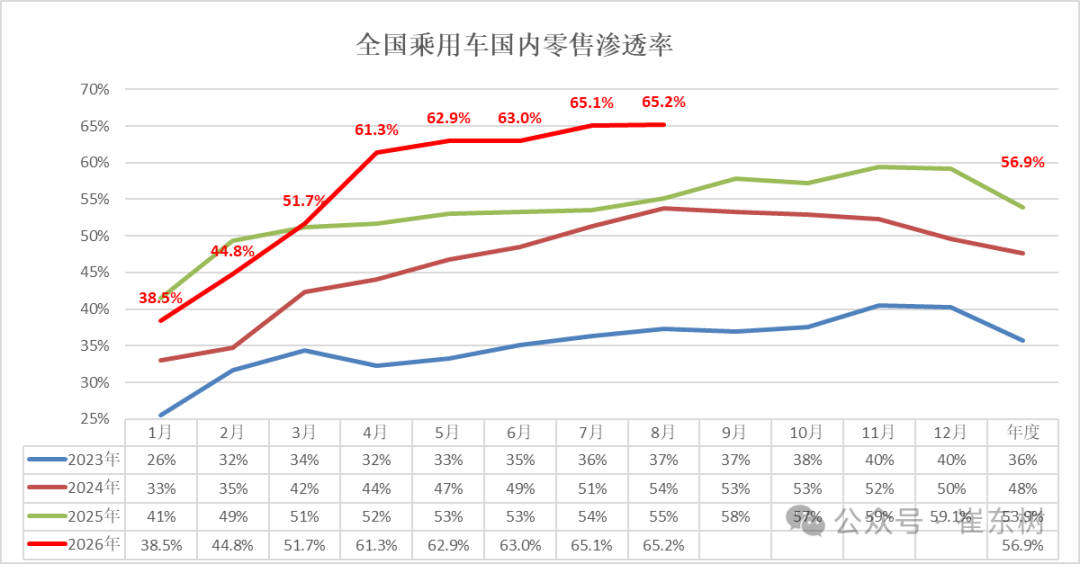
In August, the overall retail sales penetration rate of new energy vehicles in China was 65.2%, up 9.9 percentage points from the same period last year, and 0.1 percentage points from month to month.
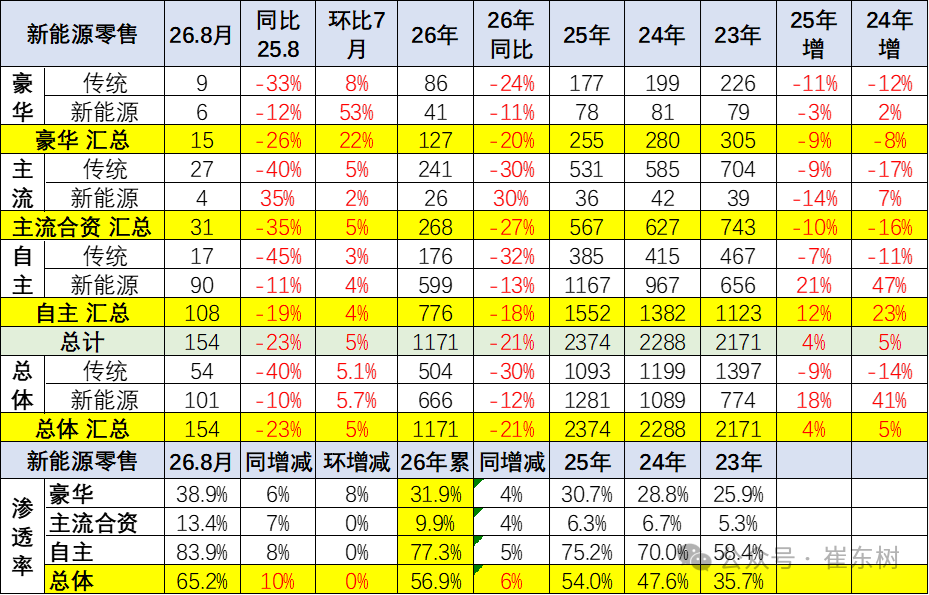
In domestic retail sales in August, the penetration rate of new energy vehicles among independent brands was 83.9%; the penetration rate of new energy vehicles among luxury cars was 38.9%; while the penetration rate of new energy vehicles in mainstream joint venture brands only rose to 13.4%.
2. Characteristics of the use of new energy passenger vehicles
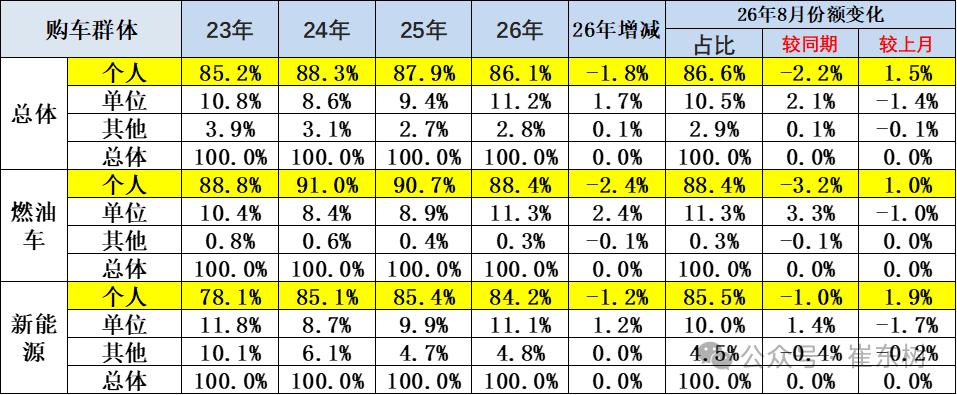
Looking at the passenger car retail structure in August, individual car purchases were still the main force, but the share declined year on year, and the share of unit car purchases rose markedly. In the fuel vehicle market, individual car purchases accounted for 88.4%, down 3.2 percentage points from year on year, and unit car purchases increased 3.3 points year on year. Public car purchases contributed significantly to fuel vehicles. New energy personal car purchases accounted for 85.5%, down 1 point year on year, and unit car purchases increased 1.4 points year on year. Both types of models showed the characteristics of a decline in the popularity of individual car purchases and the strength of unit purchases; compared with the month-on-month increase, the share of individual car purchases rebounded and unit car purchases declined, reflecting short-term monthly fluctuations, and the public market has become an important supporting force in the current car market.
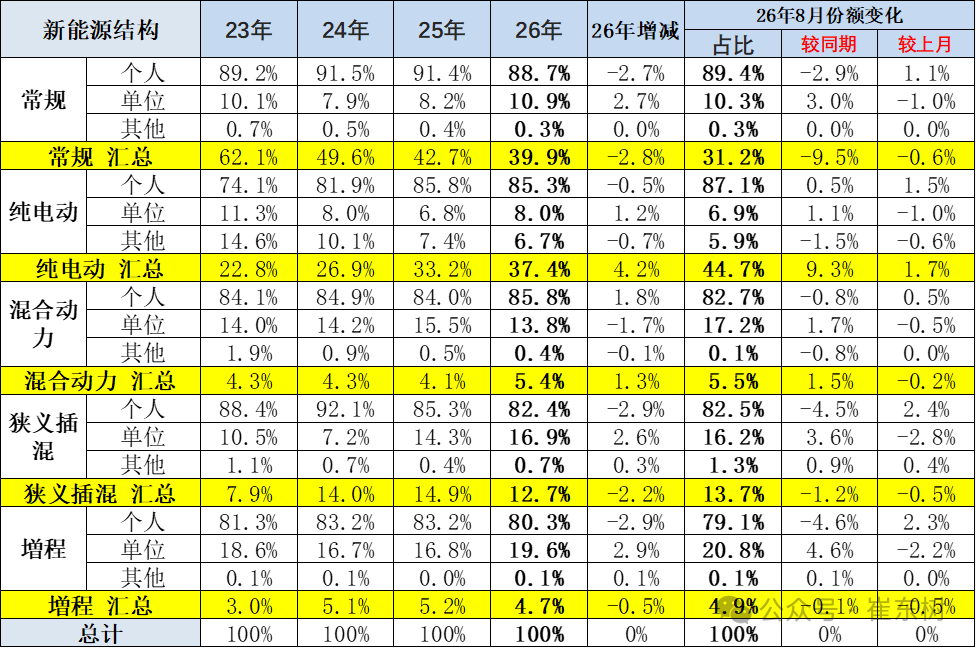
Fuel vehicle users are partly converted to hybrid and partly to pure electric, forming a new trend of electrification. In August, the NEV retail structure continued to differentiate, with pure electric accounting for 44.7%, an increase of 9.3 percentage points over the previous year. It is the core driver of NEV growth. Individual car purchases account for 87.1%, maintaining strength. The share of conventional new energy sources was only 31.2%, a sharp drop of 9.5 points from the previous year, and continued to shrink. The share of mixed and extended range declined slightly; the share of car purchases per unit of growth reached 20.8%, a sharp increase of 4.6 points over the previous year, which was clearly driven by public demand. In terms of car buyers, individual demand for pure electric power is strong, while individual shares of plug-and-play and growth have declined, unit procurement is strong, and differences in customer structure between different technology routes continue to grow.
3. Regional market performance is clearly divided
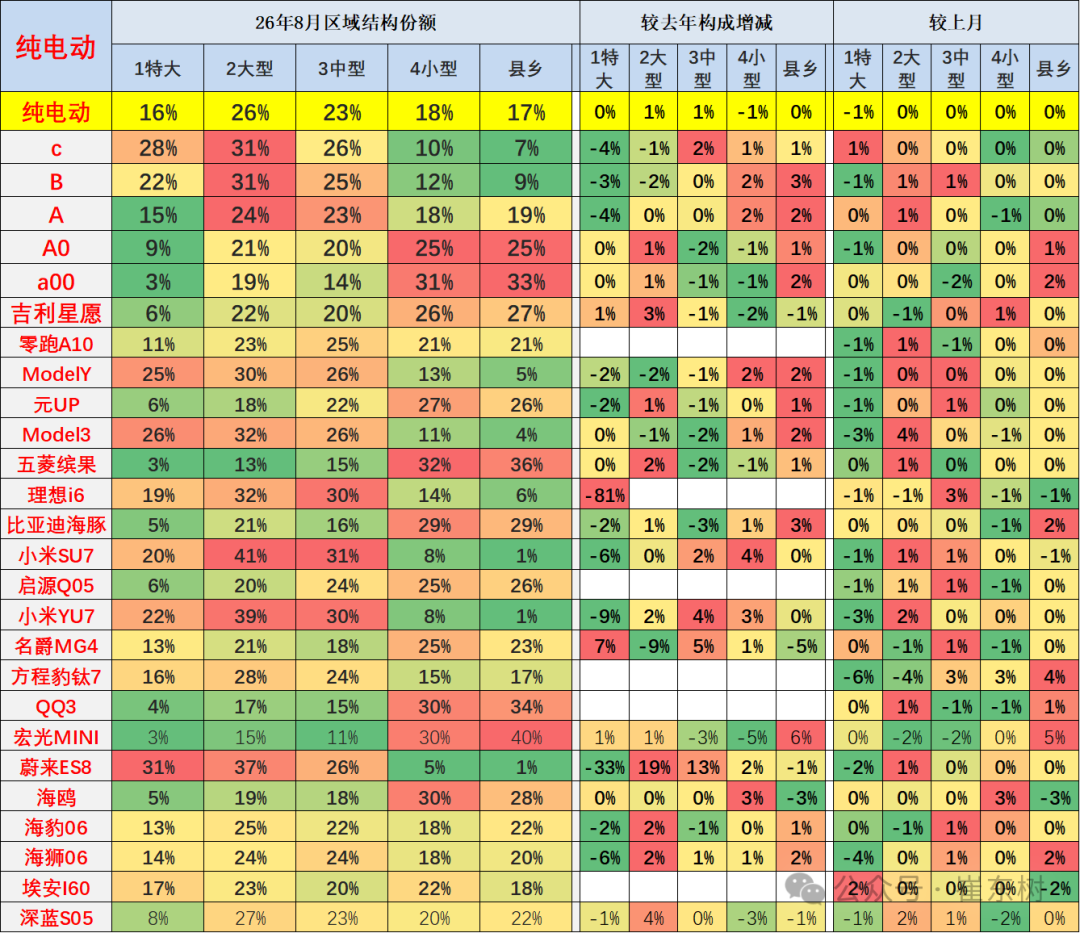
The market share of pure electric vehicles in megacities and medium-sized cities declined compared to the same period last year, while the market share in small cities and counties increased dramatically. However, looking at August compared to July, there was a decline in megacities and large cities. The growth of the current market in small cities increased relatively, that is, the growth of the current market in small cities was relatively poor compared to last year. The performance of megacities and large cities declined significantly in August.
In August, regional retail sales of pure electric models showed obvious hierarchical characteristics. The total share of oversized and large cities was 42%, and it is still the core position for high-end pure electric cars, while A00 and A0 class cars have an outstanding advantage, and the share of the county and township market generally exceeds 25%. High-end models such as the Xiaomi SU7 and NIO ES8 have a high share in large cities and weak penetration in counties and villages; entry-level models such as the Wuling Bingo and Hongguang MINI are the basic sales market in the county and rural markets. On a year-on-year basis, the share of high-end pure electricity in megacities has generally shrunk, and the share of some models in large cities has declined, reflecting the trend of saturated high-end pure electric competition in first-tier cities.
Regional structural differentiation for different models has intensified, and medium-sized and small cities have become key incremental markets for pure electric growth. The share of models such as the BYD Dolphin and Formula Leopard increased year-on-year in small and medium-sized cities, and regional balance increased. The regional structure of models such as the Ideal i6 and NIO ES8 fluctuated greatly from year to year, and the share of large cities declined markedly. The increase in the share of some models in the county and rural markets indicates that the sinking market continues to unleash potential, but the leading high-end models are more difficult to sink, and differences in consumer demand between large and small cities continue to shape the regional pattern of the pure electric market.
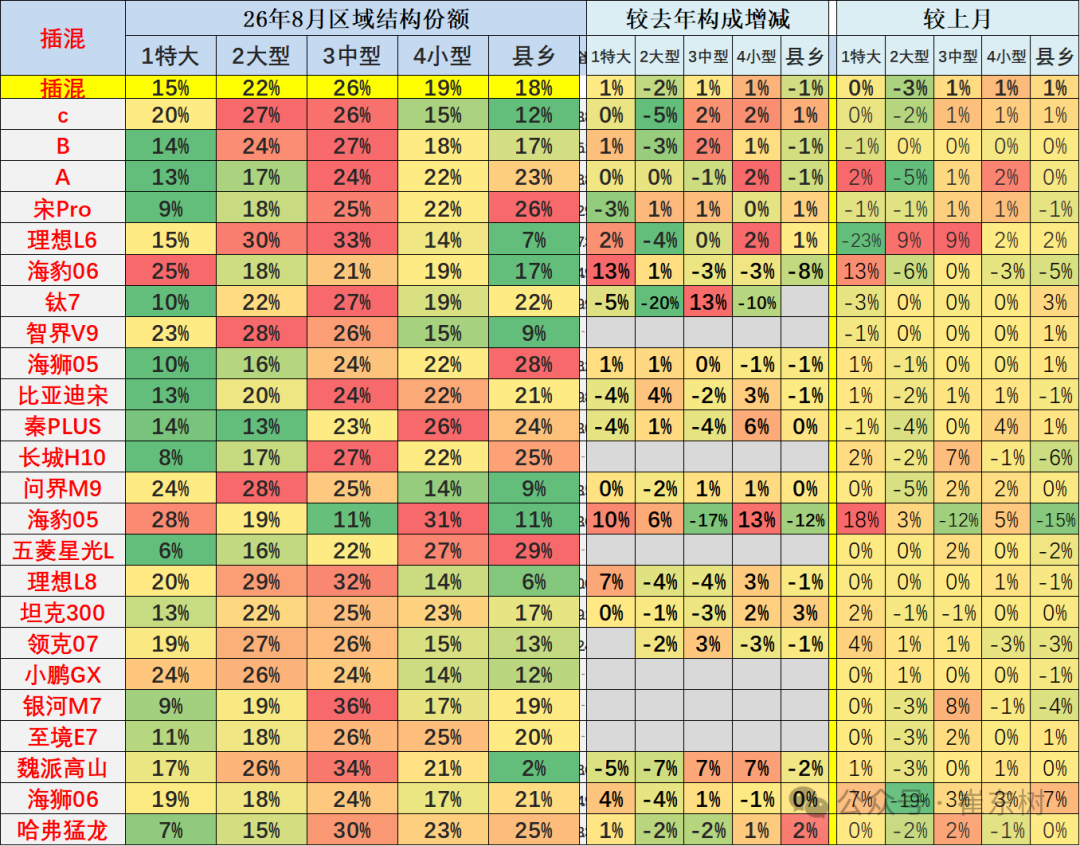
Regional retail sales of plug-in hybrid models in August showed a pattern where medium-sized cities were the core and the county and rural markets were steadily penetrating. The overall share of medium-sized cities was 26%, making them the largest sales position for plug-in mixers. High-end mixers such as Ideal L6 and Wanjie M9 are concentrated in large and medium-sized cities, and the proportion of counties and townships is low; households such as Song Pro, Qin PLUS, and Great Wall H10 are more capable of sinking, and the market share of counties and villages generally exceeds 20%. Looking at the year-on-year structure, the overall share of megacities has risen slightly, the share of large cities has declined, the contribution of medium and small cities has increased, the share of counties and towns has shrunk slightly, and the regional focus is leaning towards second- and third-tier cities.
The different plug-in hybrid models are clearly divided regionally. Models that focus on household transportation have a stable advantage in small and medium-sized cities, counties and rural markets, while high-end plug-in hybrids are highly dependent on consumption in large and medium-sized cities. The regional structure of some models fluctuated greatly. For example, the share of the SEAL 06 megacities increased by 13 percentage points over the same period last year, and the share of large Titanium-7 cities declined markedly. On a month-on-month level, the popularity of mixed megacities increased, large cities weakened, and the county and rural markets picked up slightly month-on-month. The hybrid technology route takes into account urban commuting and long-distance travel, adapts to diverse markets, and promotes the balanced development of hybrid cities at all levels.
4. Regional penetration rate of pure electric passenger vehicles - August
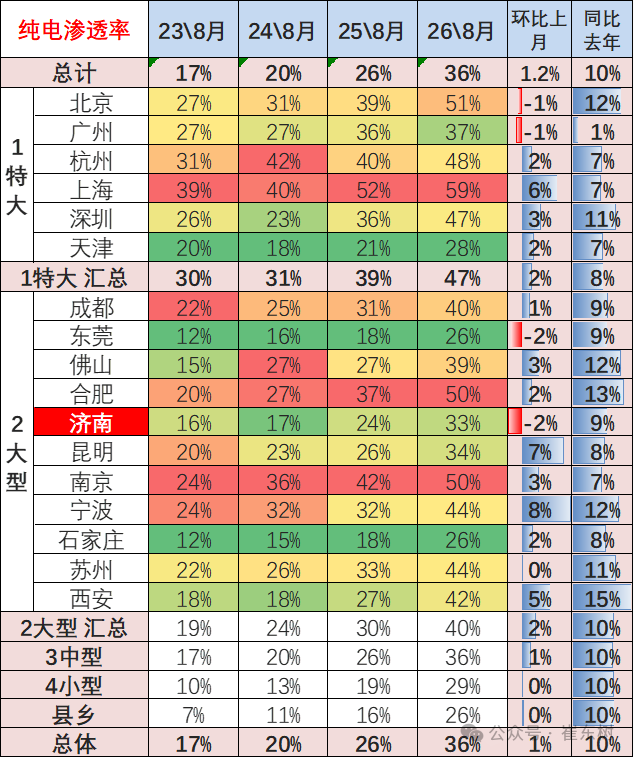
In August 2026, the penetration rate of pure electricity reached 36%, an increase of 10 percentage points over the previous year, and all levels of market growth. Megacities have a market penetration rate of 47%, still leading the way. Shanghai and Beijing have broken through 50%, and are the core highlands for the popularization of pure electricity. The overall penetration rate of large cities was 40%, and Hefei and Nanjing also stood at 50%. Cities such as Xi'an and Foshan showed impressive year-on-year increases. The high penetration rate of large and large cities stems from restrictive policies, perfect charging facilities, and leading consumption concepts. The process of replacing pure electric fuel vehicles in first-tier cities continues to accelerate, and some cities have maintained an upward trend from month to month.
The pure electricity penetration rate in the sinking market is steadily catching up, with 36% in medium-sized cities, 29% in small cities, and 26% in the county and township markets, all up 10 percentage points over the previous year, with strong growth momentum. The county and rural market increased from just 7% in August 2023 to the current 26%, which is the biggest source of increase in pure electricity growth. However, the hierarchy gap is still obvious. There is still a 21 percentage point gap between mega-large and county penetration rates, reflecting that there are still differences in charging infrastructure and consumer perceptions between urban and rural areas. The rapid rise in the penetration rate of the sinking market is driving the country's pure electricity penetration rate to continue to rise.
5. Regional penetration rate of plug-in hybrid passenger cars - August
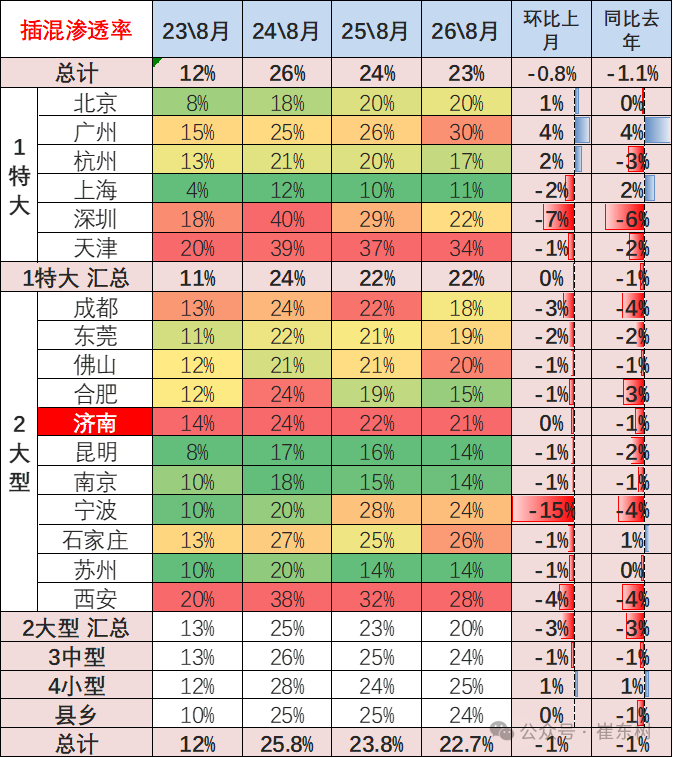
The overall penetration rate of mixed mixtures in August was 22.7%, a slight decrease of 1.1 percentage points from the previous year. The mixed penetration rate in large and large cities generally declined year over year, and the popularity of admixture in first-tier cities has cooled down somewhat. The aggregate penetration rate for mega-large cities is 22%, and large cities account for 20%. Charging conditions in large cities are sufficient, pure electricity has diverted part of the demand for hybrid car purchases, and regional differentiation is obvious.
The mixed penetration rate between medium and small cities and county and rural markets remained high and stable, reaching 24% in the county and township markets. The advantage of not being able to make up for anxiety in a sinking market is highlighted, and mixing is more suitable for long-distance travel scenarios. The trend contrasts markedly between large and small cities. The focus of mixed growth continues to shift to small and medium-sized cities, county and township markets, and has become the main energy source in the sinking market.
6. Beijing Market Trends
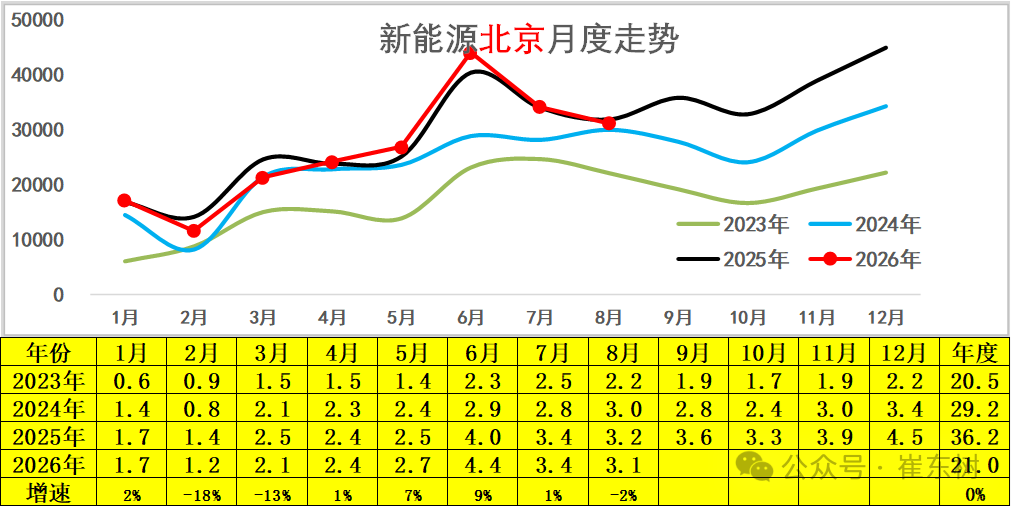
The overall trend of new energy passenger vehicles in Beijing is relatively good, showing seasonal fluctuations. Over the years, the average rise was in June and a phased low in February. Sales continued to rise from 2023 to 2025, with annual sales growing from 205,000 to 362,000. Before August 2026, it remained flat in January, fell year-on-year in February-March, picked up in April, and reached a phased high of 44,000 in June, a record high for the same period; it declined month-on-month in July-August, with a slight year-on-year decline in August. The growth momentum of the new energy market in Beijing has slowed down, which is clearly affected by the pace of release of indicators. The characteristics of “low in front” are prominent during the year.
7. Trends in the Shanghai New Energy Market
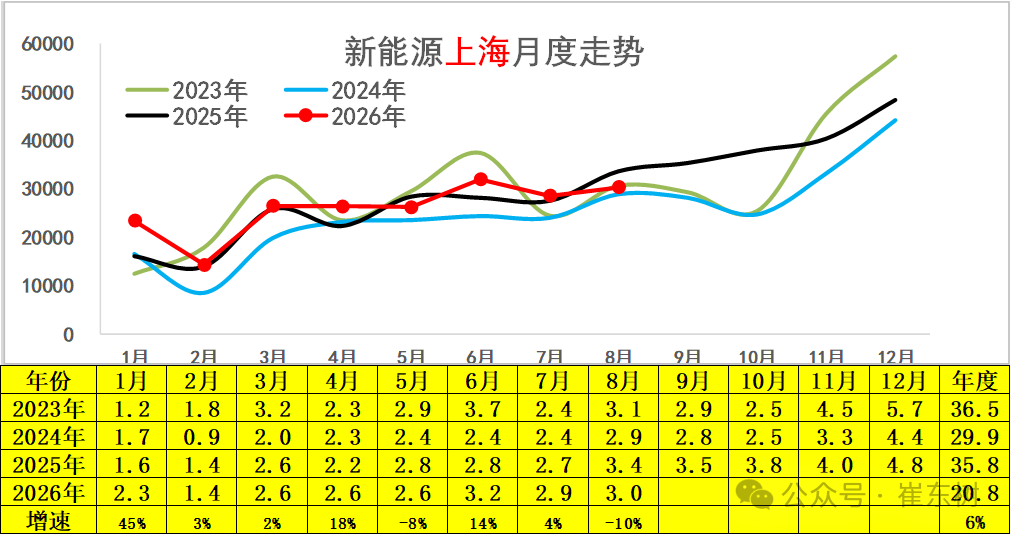
The Shanghai NEV passenger car market fluctuates markedly seasonally. February is usually a low point within the year, and the end-of-year impulse characteristics are remarkable. Annual sales remained high in 2023-2025, at 365,000 in 2023, fell to 299,000 in the short term in 2024, and rebounded to 358,000 in 2025. Before August 2026, sales surged 45% year on year in January, and maintained good growth in January-April; declined briefly in May, rebounded to 32,000 in June, slightly positive increase in July, and fell year on year in August. Overall, demand for new energy in Shanghai is quite resilient, but monthly fluctuations have increased, putting pressure on a phased basis.
8. New energy passenger vehicle market trends in restricted cities
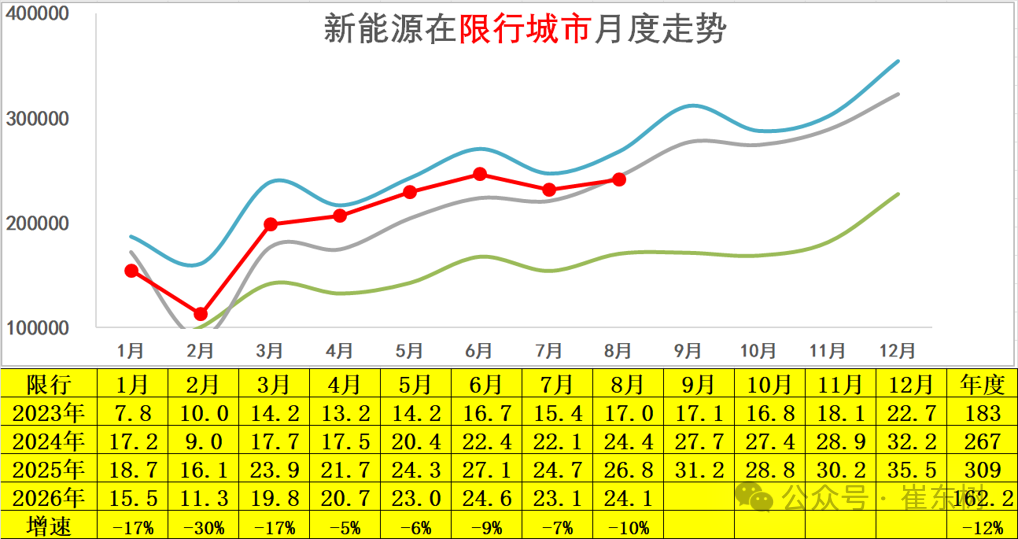
The NEV market in restricted cities from January to August 2026 was under pressure, with negative year-on-year growth in each month. The cumulative sales volume for January-August was 1.622 million units, down 12% year on year. Among them, the biggest decline was 30% in February, and the April performance was relatively resistant to decline, falling only 5%. Over the years, restricted cities have been the core incremental markets for new energy vehicles. Relying on license dividends, they continued to grow, but in 2026, they switched to a year-on-year contraction. The contraction was better than that of the small town, county, and rural markets, showing that the policy had less effect on entry-level vehicles.
9. New energy passenger vehicle market trends without restrictions on purchases in all regions
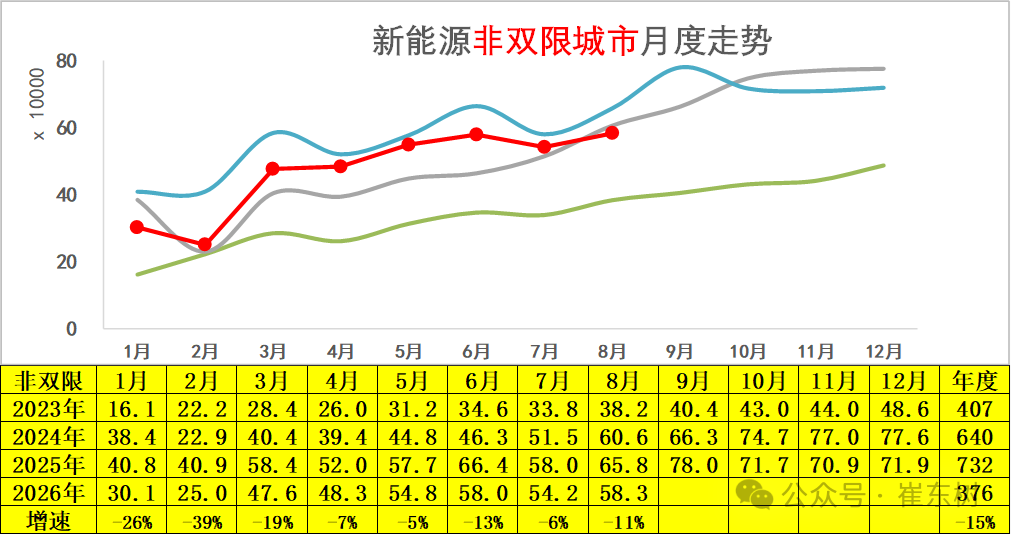
A non-restricted city means a region where we are not limited to buying or traveling fuel vehicles. Since traditional cars are not limited to purchases or travel, the demand for new energy vehicles in these cities is a real market demand. At present, non-dual-ended cities are also growing relatively rapidly. Such cities have a relatively large area of the country, and sales of new energy vehicles are currently at a relatively high level.
The new energy market in non-bipolar cities is larger. It also showed the pattern of seasonal lows in February and a rapid recovery in March. Overall, it strengthened in the second half of the year. Sales continued to rise from 2023 to 2025, and annual sales increased from 4.07 million to 7.32 million, which is the core position for new energy growth. There was a year-on-year decline in all months before 2026, with a year-on-year decline of 5% to 39%, with a cumulative year-on-year decline of 15%. The rapid growth of the non-bounded market slowed in the early stages. Consumption policy was blocked in 2026, consumption momentum weakened, and the market moved from explosive growth to a temporary adjustment phase.