
How Lower Production At Sabine Royalty Trust (SBR) Has Changed Its Investment Story
- Sabine Royalty Trust reported September 2026 production of 39,647 bbls of oil and 1,094,091 Mcf of gas, alongside a declared cash distribution of $0.331680 per unit, payable on September 29, 2026 to holders of record on September 15, 2026.
- The sharp month on month pullback in both oil and gas volumes, combined with a lower distribution, illustrates that Sabine Royalty Trust’s payout is closely tied to underlying production and commodity revenue.
- The focus now turns to how Sabine Royalty Trust’s reduced production, and the resulting lower payout, could influence the broader investment narrative.
What Is Sabine Royalty Trust's Investment Narrative?
To own Sabine Royalty Trust, you have to be comfortable owning a pure royalty vehicle that lives or dies on volumes and commodity prices rather than active capital spending. The trust does not drill or operate wells. It collects royalty checks on producing and proved undeveloped properties and passes most of that cash through to unitholders. That keeps capital intensity low, but also means there is limited control over the timing of new activity when production, such as September’s oil and gas volumes, steps down.
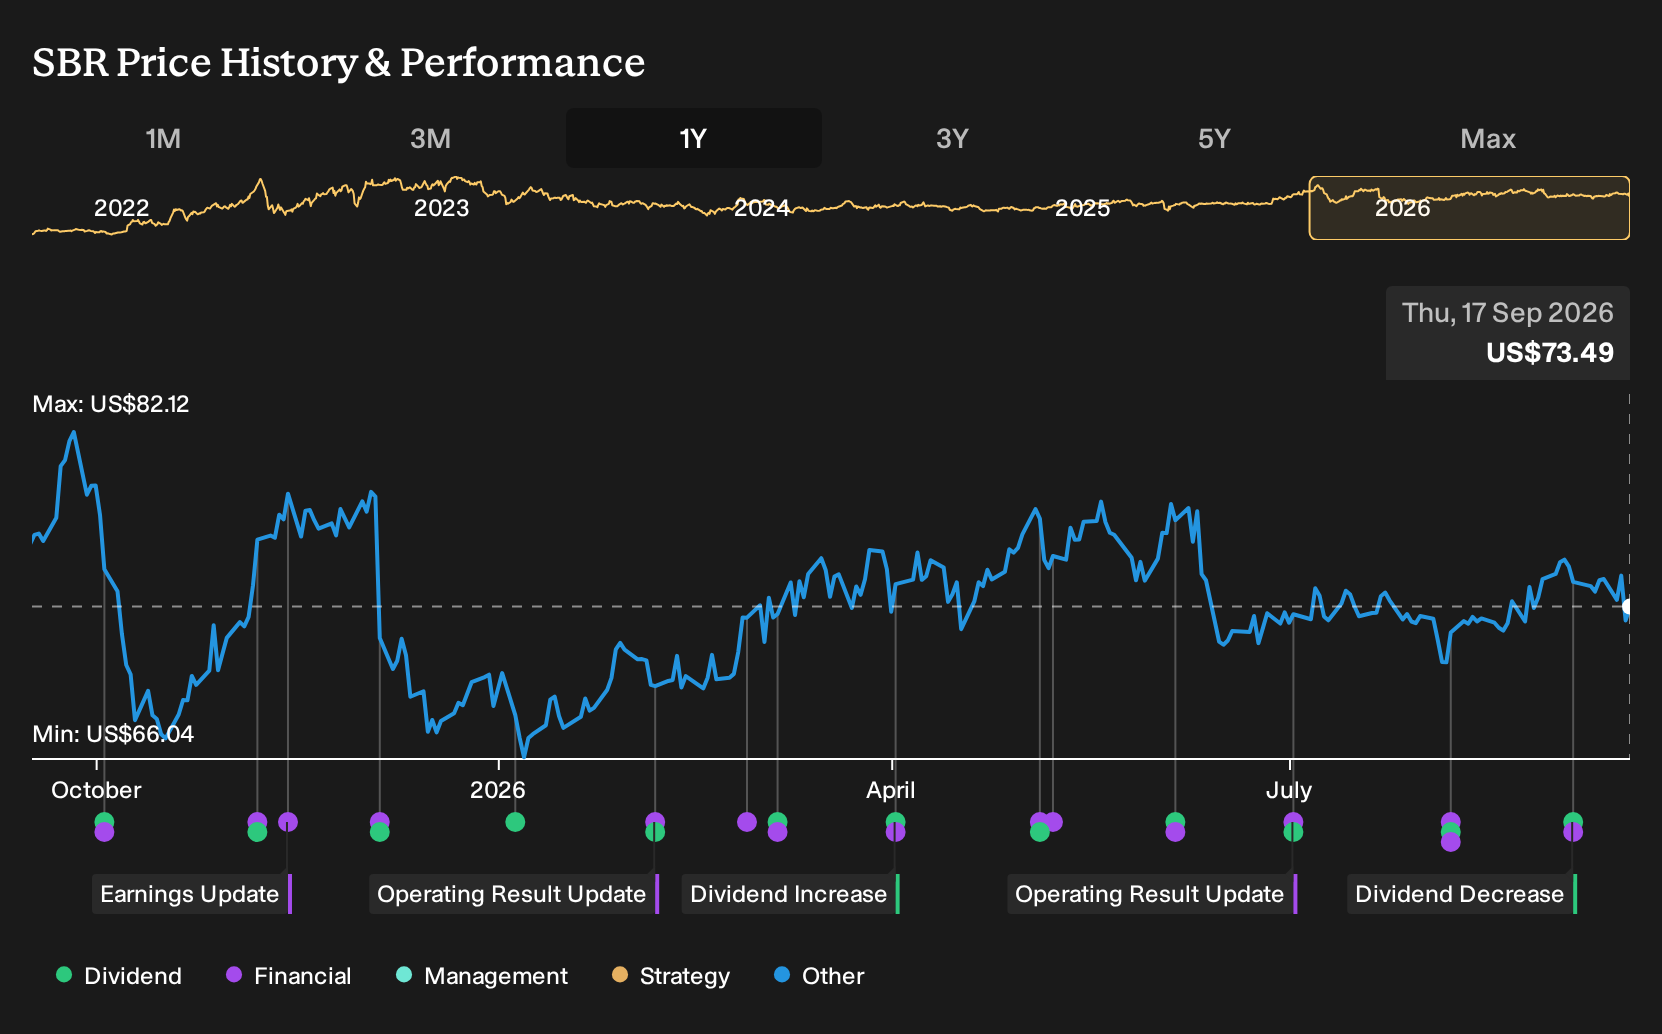
The latest distribution cut to US$0.331680 per unit highlights how quickly payouts can adjust when realized volumes or pricing soften. In the short term, the key swing factors are operational choices by operators on Sabine Royalty Trust’s acreage, plus oil and gas benchmarks, because there is no retained balance sheet to smooth cash flows. The trust has very high reported net margins and strong historical returns on equity, yet the track record on payout stability is mixed and recent price performance has lagged broader energy indices, which keeps the risk conversation active.
That said, one underappreciated pressure point for Sabine Royalty Trust sits in plain sight in the distribution math...
There's only one way to know the right time to buy, sell or hold Sabine Royalty Trust. Head to Simply Wall St's company report for the latest analysis of Sabine Royalty Trust's Fair Value.
The Verdict Is Yours
Don't just follow the ticker. Dig into the data and build a conviction that's truly your own.
- A great starting point for your Sabine Royalty Trust research is our analysis highlighting 1 key reward and 1 important warning sign that could impact your investment decision.
- See our latest analysis for Sabine Royalty Trust. The report includes a comprehensive fundamental analysis summarized in a single visual, the Snowflake, making it easy to evaluate Sabine Royalty Trust's overall financial health at a glance.
Looking For More Sabine Royalty Trust Style Income Ideas?
If the latest Sabine Royalty Trust distribution has you reassessing your income mix, it can help to compare it with other businesses that have different payout profiles and balance sheet characteristics. The Simply Wall St Screener lets you quickly compare fundamentals, cash flow support and risk across a wide range of dividend focused opportunities.
- For investors who want income with an emphasis on resilience, start with a 6 dividend fortresses that prioritise strong yields supported by underlying cash generation.
- If value is the priority, line up Sabine Royalty Trust against a 29 high quality undervalued stocks that pair quality fundamentals with what our models flag as attractive pricing.
- For those who care most about financial strength, filter for a list of solid balance sheet and fundamentals (23 results) and see how payout profiles sit on top of conservative leverage and liquidity.
This article by Simply Wall St is general in nature. We provide commentary based on historical data and analyst forecasts only using an unbiased methodology and our articles are not intended to be financial advice. It does not constitute a recommendation to buy or sell any stock, and does not take account of your objectives, or your financial situation. We aim to bring you long-term focused analysis driven by fundamental data. Note that our analysis may not factor in the latest price-sensitive company announcements or qualitative material. Simply Wall St has no position in any stocks mentioned.
Have feedback on this article? Concerned about the content? Get in touch with us directly. Alternatively, email editorial-team@simplywallst.com