
Yoshinoya Holdings (TSE:9861) Could Be Overvalued As Its P E Reaches 41x
Yoshinoya Holdings (TSE:9861) drew fresh attention after its latest share price move, with the stock closing at ¥3,639. Investors are weighing this level in relation to the group’s recent returns and earnings profile.
Recent trading has cooled some of Yoshinoya Holdings’ momentum, with the share price down 3.4% over the past month and 4.0% over the last week. At the same time, the 90-day share price return of 20.6% and 1-year total shareholder return of 18.3% indicate underlying strength that investors are still processing against the company’s earnings profile.
Scan the market for restaurant and consumer service stocks showing similar momentum patterns to Yoshinoya Holdings by checking the curated 74 high quality undiscovered gems list.
Yoshinoya Holdings now trades above the average analyst price target, yet recent share softness hints at caution. Is the stock too far ahead of fair value, or is the market still underrating its earnings profile?
Preferred P/E of 41.1x: Is it justified?
On current numbers, Yoshinoya Holdings trades on a P/E of 41.1x, which places a rich valuation on its ¥3,639 share price relative to its recent earnings.
The P/E ratio compares what investors are paying today for each unit of profit the business generates. For restaurant and hospitality operators, this yardstick helps you gauge how much of the recent earnings profile and future profit expectations are already reflected in the share price.
Yoshinoya Holdings screens as good value against its direct peers on this metric, with a P/E of 41.1x versus a peer average of 66.8x. The same ratio looks demanding against the broader Japan hospitality group, where the average sits at 22.1x. It is also well above the estimated fair P/E of 21.8x that our fair ratio model points to as a level the market could move toward if enthusiasm cools.
Explore the SWS fair ratio for Yoshinoya Holdings.
Result: Price-to-Earnings of 41.1x (OVERVALUED)
Still, the rich 41.1x P/E for Yoshinoya Holdings could come under pressure if the 4.7% revenue growth or 8.2% net income growth slows or reverses.
Find out about the key risks to this Yoshinoya Holdings narrative.
Another view on Yoshinoya Holdings’ value
The SWS DCF model takes a different angle on Yoshinoya Holdings by focusing on the ¥807.65 per share future cash flow value instead of earnings. Against the current ¥3,639 price, this points to a stock that screens as heavily overvalued on this framework. Which lens do you trust more for your own process?
For investors who want to see how this cash flow based figure is constructed step by step, Look into how the SWS DCF model arrives at its fair value.
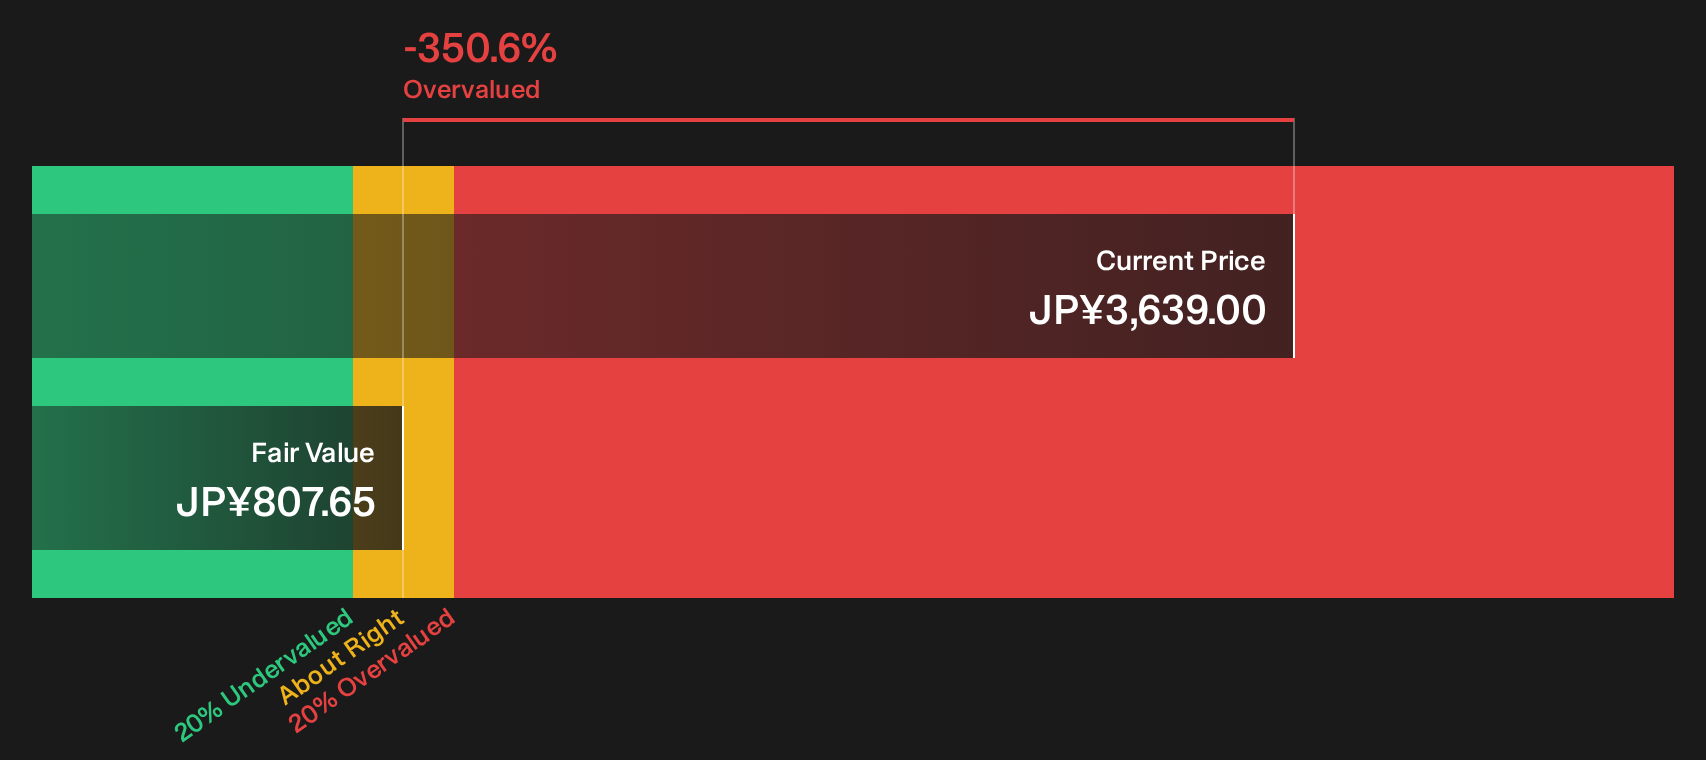
Simply Wall St performs a discounted cash flow (DCF) on every stock in the world every day (check out Yoshinoya Holdings for example). We show the entire calculation in full. You can track the result in your watchlist or portfolio and be alerted when this changes, or use our stock screener to discover 17 high quality undervalued stocks. If you save a screener we even alert you when new companies match - so you never miss a potential opportunity.
Next Steps
The signals around Yoshinoya Holdings are mixed. It can be helpful to see the full picture for yourself and act while sentiment is still forming. To round out your view, take a moment to review the 2 key rewards
Looking for more investment ideas beyond Yoshinoya Holdings?
Do not stop with Yoshinoya Holdings when there are other opportunities that could suit your style better. Use the screener to quickly surface focused lists built around clear financial traits and avoid getting stuck in random stock picking.
- Target resilient balance sheets by scanning a curated list of solid balance sheet and fundamentals (20 results) that highlights companies combining financial strength with supporting fundamentals.
- Zero in on potential mispricing opportunities by reviewing a hand picked 17 high quality undervalued stocks built around quality and valuation checks.
- Prioritise consistency and capital protection by working through a 21 resilient stocks with low risk scores tailored to businesses with lower risk scores.
This article by Simply Wall St is general in nature. We provide commentary based on historical data and analyst forecasts only using an unbiased methodology and our articles are not intended to be financial advice. It does not constitute a recommendation to buy or sell any stock, and does not take account of your objectives, or your financial situation. We aim to bring you long-term focused analysis driven by fundamental data. Note that our analysis may not factor in the latest price-sensitive company announcements or qualitative material. Simply Wall St has no position in any stocks mentioned.
Have feedback on this article? Concerned about the content? Get in touch with us directly. Alternatively, email editorial-team@simplywallst.com