
Flagstar Bank National Association (FLG) Could Be 24% Undervalued On Options Jitters And Earnings Cuts
Flagstar Bank National Association (FLG) has drawn fresh attention after a spike in implied volatility around long-dated put options, along with recent downward earnings revisions that point to a more cautious stance among analysts.
Flagstar Bank National Association’s recent slide, with the 7-day share price return down 4.78% and the 30-day share price return down 8.33%, comes on top of a 90-day share price decline of 14.33%. At the same time, the 1-year total shareholder return is 3.26%, while the 3-year and 5-year total shareholder returns remain sharply lower. This indicates that short-term momentum is fading, and longer term holders have endured significant drawdowns despite a modest recent recovery.
Scan beyond Flagstar Bank National Association and compare this setup with other high quality financials using the curated list of solid balance sheet and fundamentals (23 results) in the same space.
Flagstar Bank National Association now trades well below the average analyst target, while internal fair value work points to an even wider gap. Is the recent slide closing in on fair value or drifting away from it?
Most Popular Narrative: 24% Undervalued
Flagstar Bank National Association last closed at $12.55, while the most followed narrative pegs fair value at $16.47 using an 8.79% discount rate. As a result, the story on Flagstar is built around a sizeable valuation gap rather than a tiny mispricing.
Flagstar is deliberately rotating out of low coupon multifamily and CRE into higher yielding C&I and new, geographically diversified CRE while also paying down nearly $20 billion of high cost wholesale funding and lowering deposit costs. The combined effect of mix shift and cheaper liabilities could structurally widen net interest margin far more than implied by a flat share price outlook.
See why 7 investors see Flagstar Bank National Association as 24% undervalued.
Result: Fair Value of $16.47 (UNDERVALUED)
Still, the core story for Flagstar Bank National Association can unravel if credit normalization stalls or if New York multifamily exposure drives higher than expected losses.
Find out about the key risks to this Flagstar Bank National Association narrative.
Another View: DCF Paints A Harsher Picture For Flagstar Bank National Association
Analysts frame Flagstar Bank National Association as undervalued relative to a $16.47 fair value, yet the Simply Wall St DCF model points the other way. On that future cash flow view, an estimate of $7.83 per share suggests the stock trades rich. Which story do you trust more when real cash generation is the yardstick?
To unpack how that cash flow based result is built, and what would need to change for the DCF to move closer to the narrative fair value, Look into how the SWS DCF model arrives at its fair value..
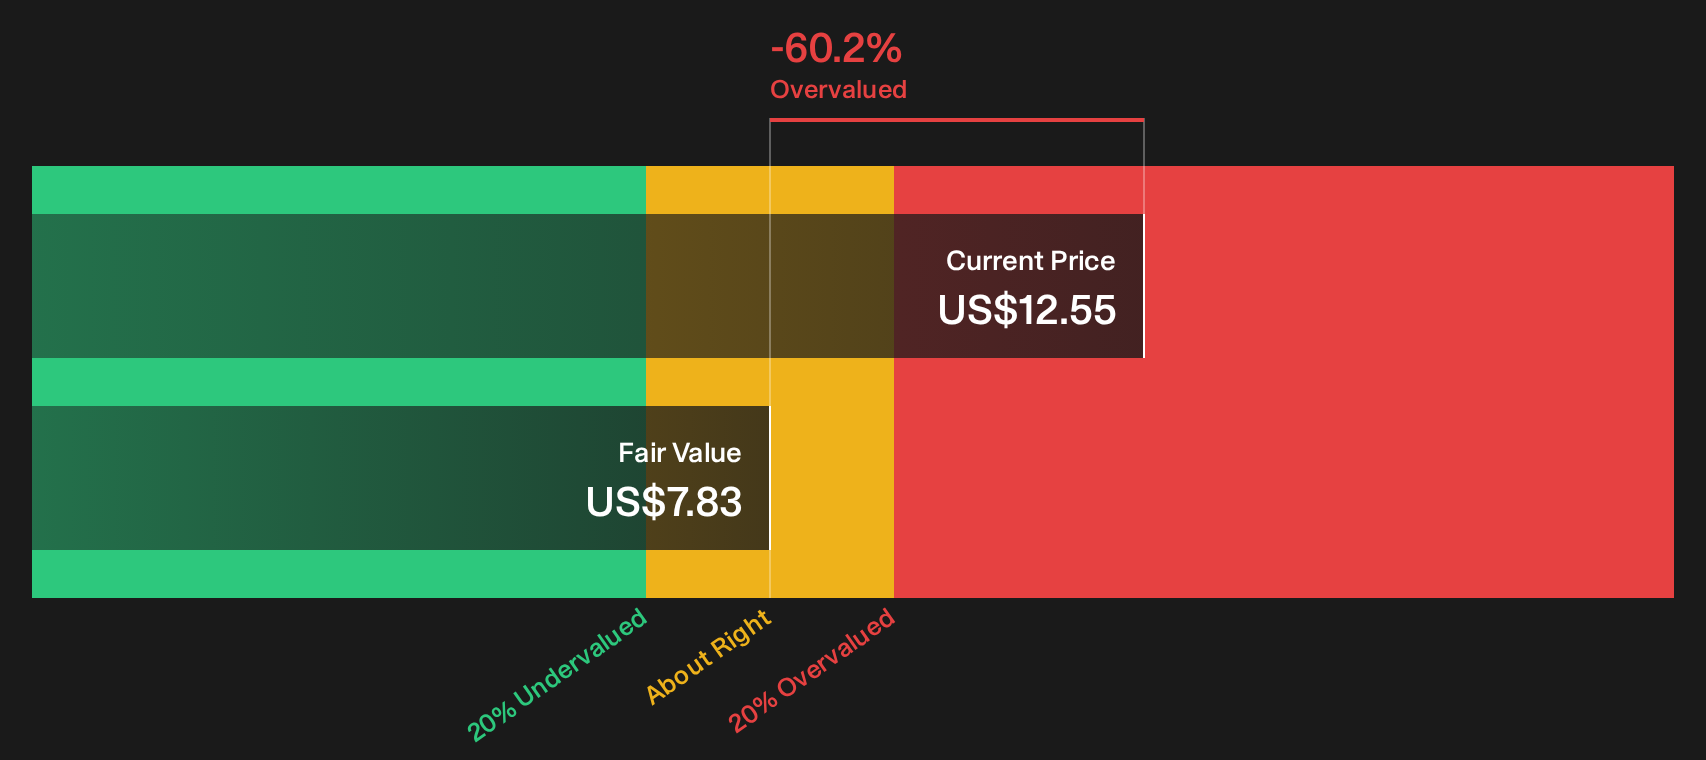
Simply Wall St performs a discounted cash flow (DCF) on every stock in the world every day (check out Flagstar Bank National Association for example). We show the entire calculation in full. You can track the result in your watchlist or portfolio and be alerted when this changes, or use our stock screener to discover 33 high quality undervalued stocks. If you save a screener we even alert you when new companies match - so you never miss a potential opportunity.
Next Steps
Mixed messages on Flagstar Bank National Association so far. If you want to move quickly and decide for yourself, weigh both sides of the story through 3 key rewards and 3 important warning signs
Looking for more investment ideas beyond Flagstar Bank National Association?
If Flagstar Bank National Association has sharpened your focus on risk, reward, and valuation, consider broadening that lens with other high quality setups before the next move leaves you reacting late.
- Target strong balance sheets and resilient fundamentals by scanning the list of solid balance sheet and fundamentals (23 results) that filters for sturdier financial footing.
- Hunt for potential mispricings by running through the curated 33 high quality undervalued stocks that highlights companies where quality and price may be out of sync.
- Focus on cash returns to shareholders by reviewing the hand picked 6 dividend fortresses that spotlights higher yielding payers with robust profiles.
This article by Simply Wall St is general in nature. We provide commentary based on historical data and analyst forecasts only using an unbiased methodology and our articles are not intended to be financial advice. It does not constitute a recommendation to buy or sell any stock, and does not take account of your objectives, or your financial situation. We aim to bring you long-term focused analysis driven by fundamental data. Note that our analysis may not factor in the latest price-sensitive company announcements or qualitative material. Simply Wall St has no position in any stocks mentioned.
Have feedback on this article? Concerned about the content? Get in touch with us directly. Alternatively, email editorial-team@simplywallst.com