
Almonty Industries (NasdaqCM:ALM) Lands Offtake Deal As Valuation Questions Return
Almonty Industries (ALM) just locked in a multi-year take-or-pay offtake deal with Sandvik subsidiary Wolfram Bergbau und Hütten AG, securing tungsten concentrate sales from recycled Los Santos tailings backed by a US$3 million upfront payment.
Almonty Industries has had a choppy few months, with the share price down 26.42% over the past 90 days and 14.46% over the last month, even as the year-to-date share price return is 57.27% and the one-year total shareholder return is 172.98%. This signals strong longer term momentum despite recent weakness.
Scan how Almonty Industries fits into the wider critical materials story by reviewing a hand-picked 36 best rare earth metal stocks that is poised to benefit from tightening Western supply chains.
Almonty Industries now trades well below both an intrinsic value estimate and published analyst targets, despite fresh contract news and a sharp short term pullback. Is that a mispricing, or a fair reflection of execution risk and project complexity?
Preferred P/E of 52x for Almonty Industries: Is it justified?
On simple earnings math, Almonty Industries trades on a rich 52x P/E while the US Metals and Mining group sits at 20.8x and its peer set averages 25.9x. That gap suggests the market is paying a premium multiple for each dollar of current earnings at a time when the share price has been volatile over the past three months.
The P/E ratio compares the latest share price with per share earnings and is often used for miners once they have moved into profitability. For Almonty Industries, a 52x reading indicates that investors are pricing in strong earnings progress, rather than treating recent profits as a mature, steady state.
That premium comes with tension. The stock is described as trading 66.8% below an intrinsic value estimate and below an SWS DCF future cash flow value of $41.73. At the same time, the market multiple is described as expensive versus peers and an estimated fair P/E of 36.8x. The contrast suggests investors are paying far more than sector averages for current earnings, while some models see room for value if growth and cash generation unfold as expected.
Compared to the broader US Metals and Mining industry at 20.8x, the 52x P/E for Almonty Industries stands out as materially higher. It also exceeds the 36.8x level that quantitative work highlights as a fair ratio the market could move toward over time.
Explore the SWS fair ratio for Almonty Industries.
Result: Price-to-earnings of 52x (OVERVALUED).
Still, the heavy 52x P/E looks vulnerable if project costs rise at complex sites or if tungsten pricing weakens and reduces future earnings power.
Find out about the key risks to this Almonty Industries narrative.
Another View on Almonty Industries’ Value
While the P/E screen paints Almonty Industries as expensive on current earnings, the SWS DCF model points the other way. It puts future cash flow value at $41.73 per share versus a recent price of $13.84, which implies the stock trades well below that estimate. Which signal should carry more weight for you?
Look into how the SWS DCF model arrives at its fair value.
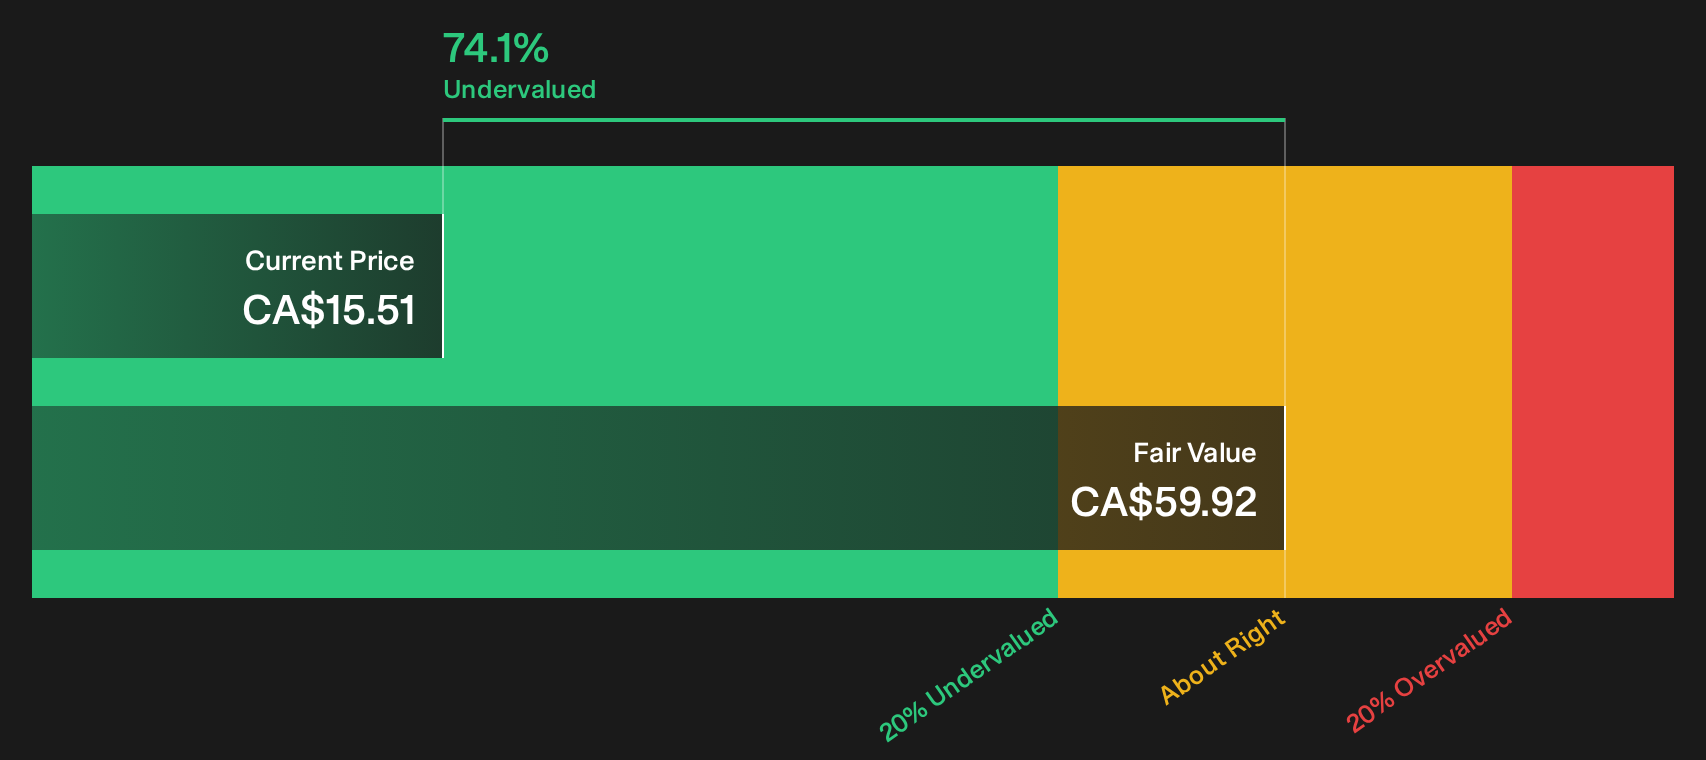
Simply Wall St performs a discounted cash flow (DCF) on every stock in the world every day (check out Almonty Industries for example). We show the entire calculation in full. You can track the result in your watchlist or portfolio and be alerted when this changes, or use our stock screener to discover 33 high quality undervalued stocks. If you save a screener we even alert you when new companies match - so you never miss a potential opportunity.
Next Steps
Mixed signals on Almonty Industries so far. If you want to move quickly and build conviction, go straight to the underlying data and weigh the trade off between upside and risk for yourself by checking the 4 key rewards and 4 important warning signs.
Ready for more Almonty Industries style ideas?
If Almonty Industries has caught your attention, do not stop at a single ticker. Use this moment to widen your watchlist and pressure test your thesis.
- Target steady compounding potential by reviewing a 33 high quality undervalued stocks that blend solid fundamentals with appealing P/E and cash flow profiles.
- Prioritise resilience by scanning a 30 resilient stocks with low risk scores built around balance sheet strength and lower historical volatility.
- Hunt for future standouts with a 16 high quality undiscovered gems that flags quality businesses still flying under most investors' radars.
This article by Simply Wall St is general in nature. We provide commentary based on historical data and analyst forecasts only using an unbiased methodology and our articles are not intended to be financial advice. It does not constitute a recommendation to buy or sell any stock, and does not take account of your objectives, or your financial situation. We aim to bring you long-term focused analysis driven by fundamental data. Note that our analysis may not factor in the latest price-sensitive company announcements or qualitative material. Simply Wall St has no position in any stocks mentioned.
Have feedback on this article? Concerned about the content? Get in touch with us directly. Alternatively, email editorial-team@simplywallst.com