
Dynex Capital (DX) Could Be 45% Undervalued As Dividend Terms Reset The Debate
Dynex Capital (DX) just put fresh income terms on the table. The mortgage REIT approved a quarterly preferred dividend and affirmed its common payout, giving investors updated cash flow figures to weigh against the current share price.
Recent price action has been weak, with Dynex Capital’s share price falling 8.63% over the past month and 13.49% year to date to US$12.18, even though the 1 year total shareholder return of 15.83% and 3 year total shareholder return of 50.36% indicate much stronger longer term momentum.
Spot 6 dividend fortresses that, like Dynex Capital, pair meaningful cash payouts with income terms you can actually track.Bullish investors see Dynex Capital’s pullback and income profile as a mismatch, while cautious holders point to recent price pressure. Which side does the current valuation evidence support next?
Price-to-Earnings of 7.1x: Is it justified?
On basic valuation math, Dynex Capital screens as inexpensive. The stock trades on a P/E of 7.1x at a last close of $12.18, which sits below both the broader US market and the Mortgage REIT peer group that cluster around higher earnings multiples.
P/E compares the current share price with the earnings per share and for mortgage REITs it often reflects how the market weighs income streams against balance sheet and funding risk. A lower ratio can signal that investors are demanding a wider margin of safety for those earnings or that they view current profitability as hard to repeat.
Dynex Capital complicates that simple read. The business shows very large earnings growth over the past year and high net profit margins of 84.7%, and its earnings are forecast to grow around 20% per year, faster than the wider US market. Yet the dividend yield of 16.75% is flagged as not being well covered by free cash flow, debt coverage by operating cash flow is weak, and all liabilities come from higher risk external borrowing. This can justify some caution from income focused investors even when reported earnings look strong.
Compared with the US Mortgage REITs industry average P/E of 8.4x, Dynex Capital trades at a clear discount. Against an estimated fair P/E of 13x, the current 7.1x multiple looks even more conservative. This implies the market is pricing the stock well below a level its earnings profile could potentially support if sentiment or risk perception shifted toward that fair ratio.
Explore the SWS fair ratio for Dynex Capital.
Result: Price-to-Earnings of 7.1x (UNDERVALUED)
Still, that high 16.75% dividend yield, weak debt coverage by operating cash flow, and reliance on external borrowing could quickly pressure Dynex Capital if funding conditions tighten.
Find out about the key risks to this Dynex Capital narrative.
Another View: SWS DCF Puts a Lower Fair Value on Dynex Capital
The P/E points one way for Dynex Capital, but the SWS DCF model pulls in the opposite direction. On that cash flow lens, an estimated value of about $4.28 per share sits well below the current $12.18 price. This frames Dynex Capital as expensive rather than cheap. Which signal do you trust more when earnings and cash flow tell different stories?
Look into how the SWS DCF model arrives at its fair value.
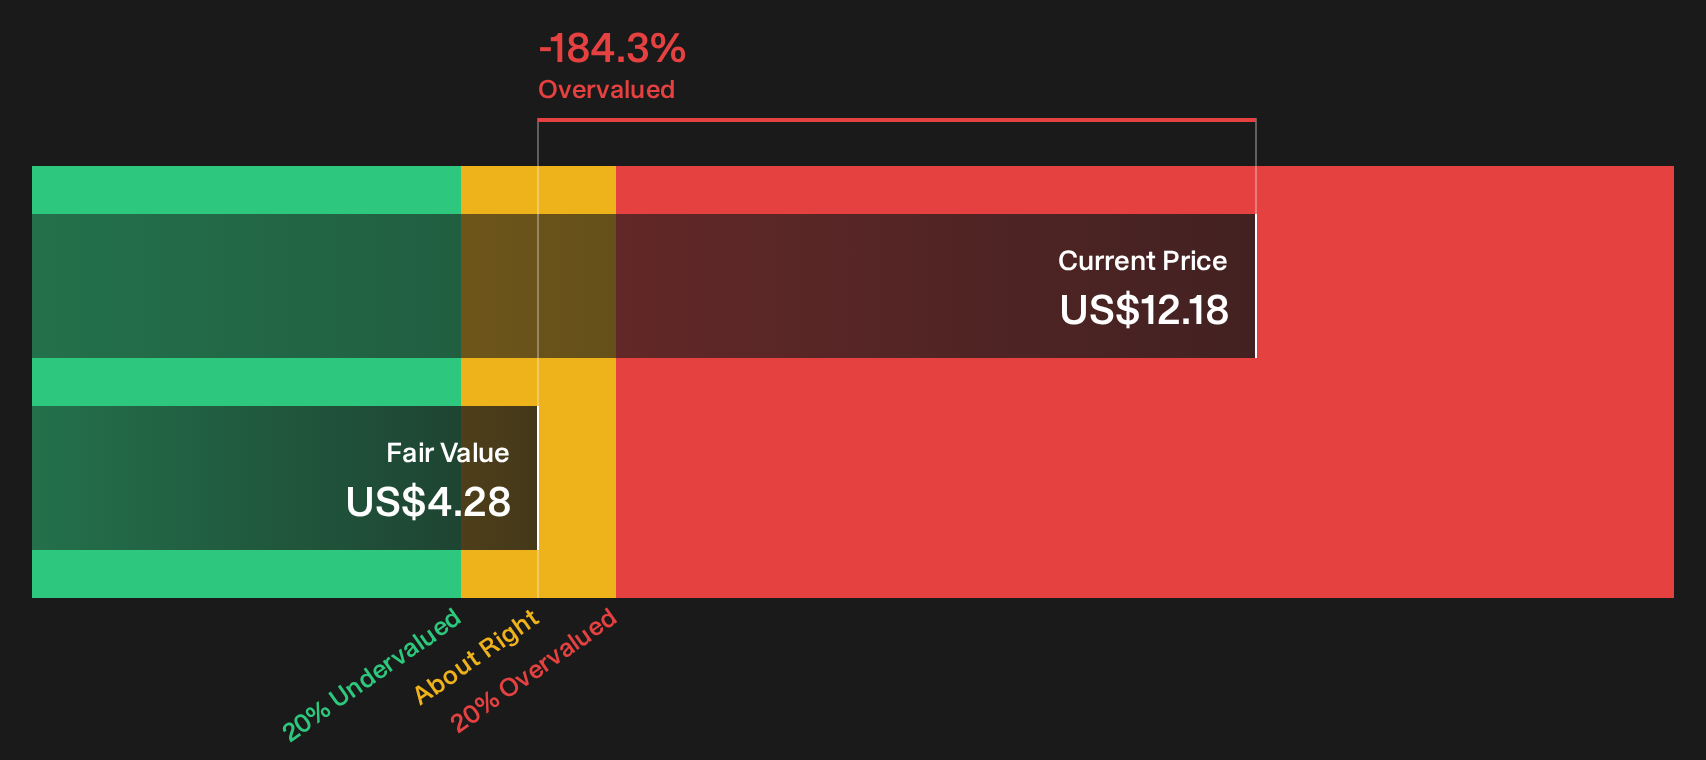
Simply Wall St performs a discounted cash flow (DCF) on every stock in the world every day (check out Dynex Capital for example). We show the entire calculation in full. You can track the result in your watchlist or portfolio and be alerted when this changes, or use our stock screener to discover 33 high quality undervalued stocks. If you save a screener we even alert you when new companies match - so you never miss a potential opportunity.
Next Steps
Sentiment on Dynex Capital is clearly split, so treat this as your prompt to move fast. Review the full balance of risks and rewards, then weigh the 5 key rewards and 3 important warning signs.
Looking for more ideas beyond Dynex Capital?
If Dynex Capital has sharpened your focus on income and value, do not stop here. Strong portfolios usually start with a broader watchlist of quality options.
- Hunt for mispriced quality by scanning the 33 high quality undervalued stocks that combine solid fundamentals with compressed valuations.
- Prioritize resilience by reviewing the list of solid balance sheet and fundamentals (23 results) so you can focus on businesses with stronger financial footing.
- Get ahead of the crowd by checking the 16 high quality undiscovered gems that most investors are not watching yet.
This article by Simply Wall St is general in nature. We provide commentary based on historical data and analyst forecasts only using an unbiased methodology and our articles are not intended to be financial advice. It does not constitute a recommendation to buy or sell any stock, and does not take account of your objectives, or your financial situation. We aim to bring you long-term focused analysis driven by fundamental data. Note that our analysis may not factor in the latest price-sensitive company announcements or qualitative material. Simply Wall St has no position in any stocks mentioned.
Have feedback on this article? Concerned about the content? Get in touch with us directly. Alternatively, email editorial-team@simplywallst.com