
Monarch Casino & Resort (MCRI) Draws Attention For Cash Flow, Is The Valuation Justified?
Recent commentary around Monarch Casino & Resort (MCRI) has zeroed in on one issue. Are its current cash flows and capital allocation plans, including potential acquisitions, enough to support where the shares trade today?
Monarch Casino & Resort’s recent pullback, with the share price down 6.17% over 90 days and 3.66% over the past month, sits against a much stronger backdrop, including a 26.48% year to date share price return and a 101.11% three year total shareholder return. This keeps the focus on whether current cash generation still justifies a US$121.47 price tag.
Scan how Monarch Casino & Resort stacks up on cash generation and valuation against other hand picked operators by reviewing the 35 high quality undervalued stocks poised for a potential rerating.
Bulls point to Monarch Casino & Resort’s solid cash generation and recent track record, while bears see a rich price and acquisition risk creeping in. Which side do the current valuation markers actually support?
Preferred P/E of 19x for Monarch Casino & Resort: Is it justified?
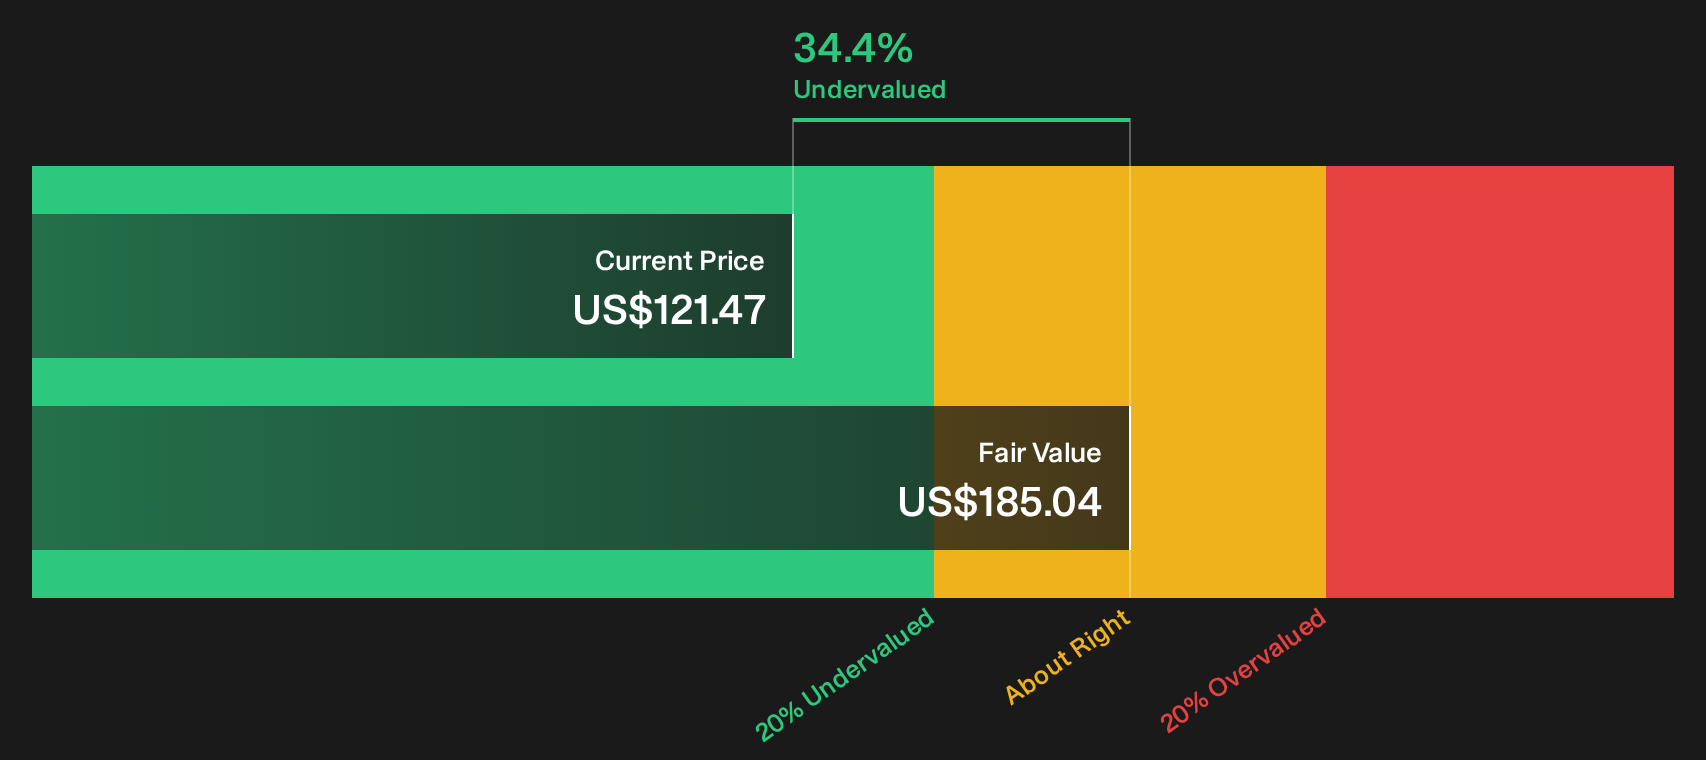
Valuation work on Monarch Casino & Resort points in two directions at once, with the SWS DCF model suggesting the shares are trading below an estimated fair value of $185.04, while the current P/E of 19x at a $121.47 price hints at a richer tag when compared with an internal fair P/E of 16x.
The P/E ratio shows how much investors are paying today for each dollar of Monarch Casino & Resort’s earnings, which matters a lot for a mature, profitable hospitality operator where earnings quality and growth visibility are central. A 19x multiple, combined with earnings growth of 7.4% per year over the past 5 years and high quality reported profits, suggests buyers are accepting a relatively full ticket price for current cash generation rather than banking on rapid expansion.
Against peers, the picture changes. Monarch Casino & Resort trades on a P/E of 19x compared with a peer group average of 50.8x and a US Hospitality industry average of 20.6x, which is a strong relative discount versus selected operators and modestly below the broader sector. That said, an estimated fair P/E of 16x implies the market could still compress the multiple closer to that level if profit growth tracks current forecasts instead of surprising to the upside.
Explore the SWS fair ratio for Monarch Casino & Resort.
Result: Price-to-earnings of 19x (ABOUT RIGHT)
Still, the story around Monarch Casino & Resort could shift quickly if acquisition spending disappoints or if the current P/E compresses because sentiment cools.
Find out about the key risks to this Monarch Casino & Resort narrative.
Another View on Monarch Casino & Resort’s Value
A second lens on Monarch Casino & Resort uses the SWS DCF model, which points to an estimated fair value of $185.04 per share versus the current $121.47 level. That gap suggests the market is assigning a much lower value to projected cash flows. Is that caution or an opening?
Look into how the SWS DCF model arrives at its fair value.
Simply Wall St performs a discounted cash flow (DCF) on every stock in the world every day (check out Monarch Casino & Resort for example). We show the entire calculation in full. You can track the result in your watchlist or portfolio and be alerted when this changes, or use our stock screener to discover 35 high quality undervalued stocks. If you save a screener we even alert you when new companies match - so you never miss a potential opportunity.
Next Steps
Sentiment around Monarch Casino & Resort is clearly split, so treat this as a prompt to move fast, review the numbers yourself, and decide where you stand. To see what the market is currently optimistic about, start by weighing the 3 key rewards
Looking for more Monarch Casino & Resort style ideas?
If Monarch Casino & Resort has you thinking harder about price and quality, do not stop here. A few targeted stock lists can widen your opportunity set fast.
- Target resilient performers that prioritise capital preservation by scanning a focused group of 30 resilient stocks with low risk scores that score well on risk metrics.
- Hunt for mispriced potential by reviewing a curated pool of 16 high quality undiscovered gems that pair strong fundamentals with relatively low market attention.
- Build a sturdier core for your portfolio by concentrating on a list of solid balance sheet and fundamentals (23 results) that highlights financially robust companies with sound fundamentals.
This article by Simply Wall St is general in nature. We provide commentary based on historical data and analyst forecasts only using an unbiased methodology and our articles are not intended to be financial advice. It does not constitute a recommendation to buy or sell any stock, and does not take account of your objectives, or your financial situation. We aim to bring you long-term focused analysis driven by fundamental data. Note that our analysis may not factor in the latest price-sensitive company announcements or qualitative material. Simply Wall St has no position in any stocks mentioned.
Have feedback on this article? Concerned about the content? Get in touch with us directly. Alternatively, email editorial-team@simplywallst.com