
Why National HealthCare (NHC) Is Getting Fresh Attention
National HealthCare (NHC) has been drawing fresh attention after a recent move in its valuation metrics, with investors weighing a market value of about US$3.48b against its current fundamentals.
Recent trading has cooled slightly, with the share price down 4.84% over the past month. Even so, National HealthCare still carries a 10.28% 90 day share price gain and a very strong 92.74% 1 year total shareholder return, which points to momentum that has been building rather than fading as investors reassess the company against its current valuation.
Scan other companies showing strong momentum alongside National HealthCare with the hand picked 35 high quality undervalued stocks that still trade below their estimated fair value.
National HealthCare has cooled after a strong run, which puts investors at a fork in the road. Is this the moment to commit, or does patience prevail while the valuation case develops in more detail next?
Preferred P/E of 24.8x for National HealthCare: Is it justified?
National HealthCare currently trades on a P/E of 24.8x, a level that prices in a lot of earnings strength when set against the last close at $222.11 and the recent share price gains.
The P/E multiple simply compares the share price to earnings per share, which gives you a quick sense of how much investors are willing to pay for each dollar of profit. For a healthcare services operator like National HealthCare, this lens is often used because the business generates consistent earnings and investors tend to focus heavily on profitability rather than pure revenue scale.
That 24.8x figure runs a touch hotter than both its direct peers on 23.4x and the wider US Healthcare industry on 24x. The market is therefore attaching a richer price tag to National HealthCare's earnings than it does to comparable operators, even though there is insufficient data on forward growth and the company's own valuation checks flag high quality earnings, a 33.8% earnings uptick in the past year, and a 49.2% discount to the SWS DCF fair value estimate as key context points.
Result: Price-to-earnings of 24.8x (OVERVALUED).
See what the numbers say about this price — find out in our valuation breakdown.
Still, the National HealthCare story can change quickly if regulatory funding tightens or if inpatient volumes soften, which could pressure earnings behind that 24.8x P/E.
Find out about the key risks to this National HealthCare narrative.
Another view on National HealthCare’s value
The P/E of 24.8x may look punchy, yet the SWS DCF model presents a different picture. On that framework, National HealthCare at $222.11 is described as trading below an estimated future cash flow value of $437.57. This suggests a wide valuation gap that investors need to explain for themselves. Is the market being cautious, or is the model too optimistic?
Look into how the SWS DCF model arrives at its fair value.
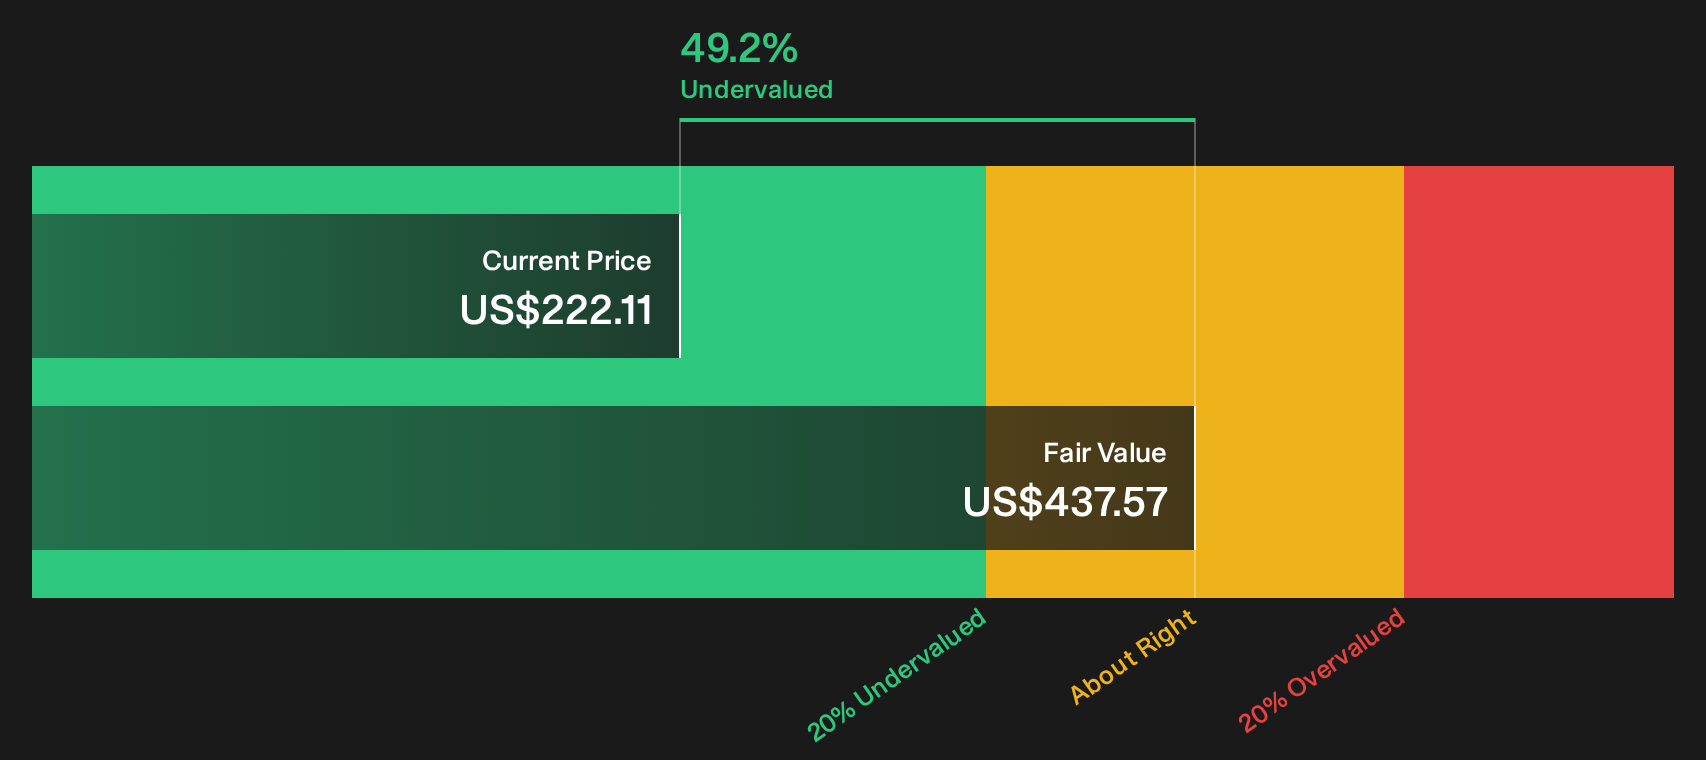
Simply Wall St performs a discounted cash flow (DCF) on every stock in the world every day (check out National HealthCare for example). We show the entire calculation in full. You can track the result in your watchlist or portfolio and be alerted when this changes, or use our stock screener to discover 35 high quality undervalued stocks. If you save a screener we even alert you when new companies match - so you never miss a potential opportunity.
Next Steps
Sentiment around National HealthCare is clearly split, which is exactly when it pays to move fast and test the numbers yourself before the mood shifts. To see how the mix of concerns and potential upsides stacks up in one place, review the 2 key rewards and 1 important warning sign
Looking for more National HealthCare style investment ideas?
If you like how National HealthCare tests your thinking, do not stop here. Use the screeners below to uncover other opportunities before the crowd does.
- Target steady income and potential resilience by reviewing companies screened as 7 dividend fortresses that may suit an income focused watchlist.
- Hunt for quality that does not shout its story yet and scan the 16 high quality undiscovered gems for businesses with strong fundamentals that remain under the radar.
- Prioritise capital protection first and use the 30 resilient stocks with low risk scores to narrow in on businesses assessed with lower risk scores.
This article by Simply Wall St is general in nature. We provide commentary based on historical data and analyst forecasts only using an unbiased methodology and our articles are not intended to be financial advice. It does not constitute a recommendation to buy or sell any stock, and does not take account of your objectives, or your financial situation. We aim to bring you long-term focused analysis driven by fundamental data. Note that our analysis may not factor in the latest price-sensitive company announcements or qualitative material. Simply Wall St has no position in any stocks mentioned.
Have feedback on this article? Concerned about the content? Get in touch with us directly. Alternatively, email editorial-team@simplywallst.com