
Daikin IndustriesLtd (TSE:6367) Could Be 21% Undervalued Following Climate Week Focus
Daikin IndustriesLtd (TSE:6367) moved into focus after Daikin U.S. Corporation said senior leaders will join Climate Week NYC 2026, spotlighting energy efficiency, electrification, HVAC performance, refrigerant management, and resilient buildings for rising power demand.
Against that Climate Week backdrop, Daikin IndustriesLtd’s recent trading has been softer in the short term, with the share price down 13.2% over the past 90 days. However, the 1 year total shareholder return of 21.6% points to longer term momentum building as the market reassesses growth potential and risks around its energy efficiency positioning.
Scan for more businesses linked to the same energy efficiency and electrification theme as Daikin IndustriesLtd by reviewing our curated list of 39 power grid technology and infrastructure stocks.
Daikin IndustriesLtd now trades at ¥20,740 while analyst targets and intrinsic estimates sit higher, creating a visible gap. Is that discount justified by the fundamentals, or is the market being overly cautious on valuation?
Price-to-Earnings of 21.1x: Is it justified?
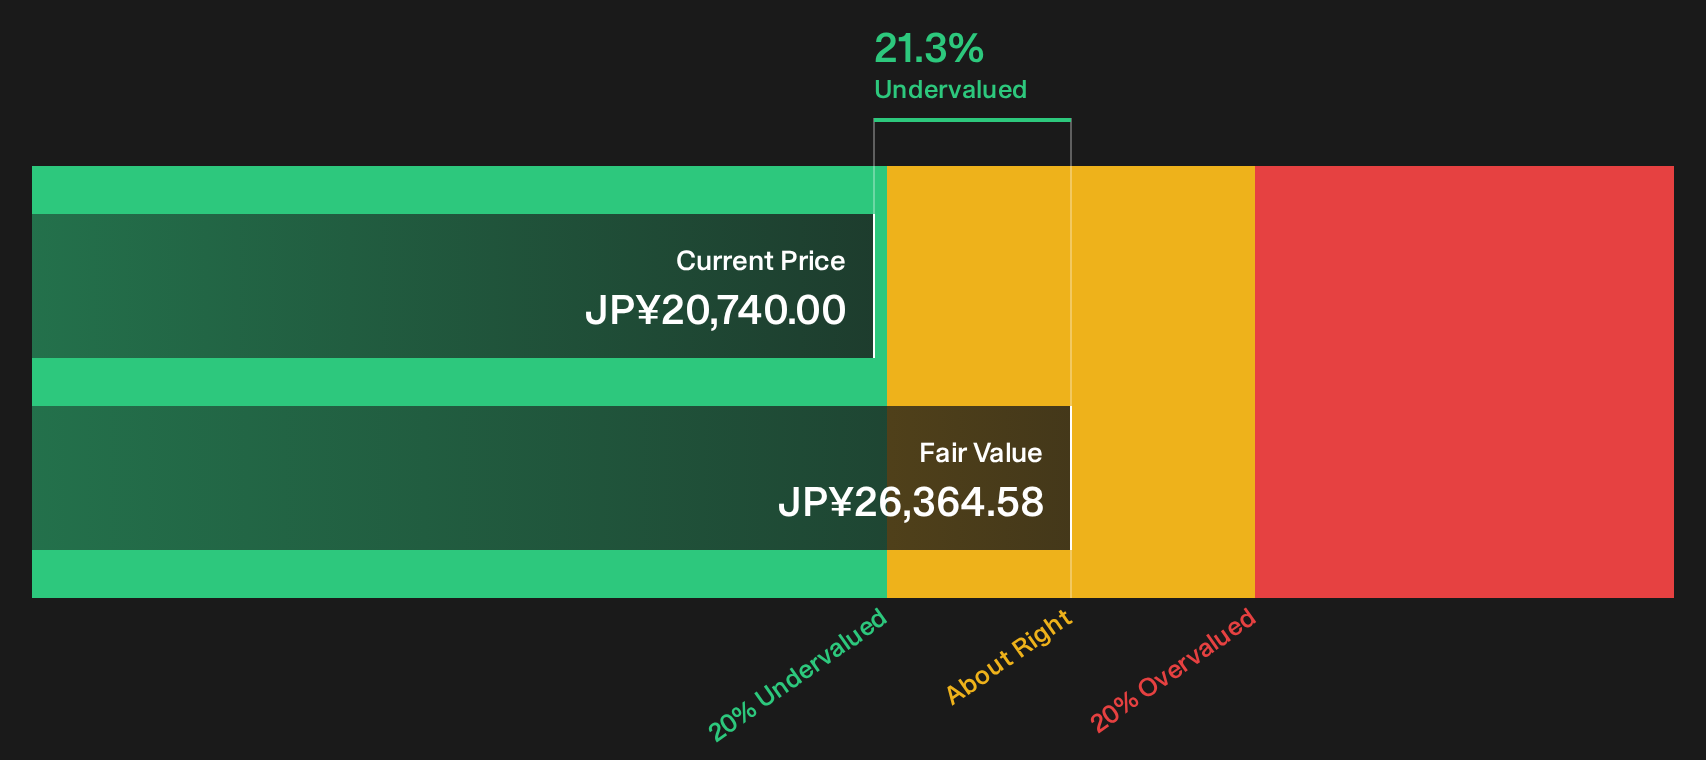
Daikin IndustriesLtd trades at ¥20,740 while our DCF fair value estimate sits at ¥26,364.58, so the stock is flagged as good value on that model, yet the P/E ratio of 21.1x paints a more expensive picture against peers.
The P/E multiple measures how much investors are paying for each unit of earnings, which is especially watched for an established manufacturer like Daikin IndustriesLtd with a broad HVAC and fluorochemicals footprint. A 21.1x P/E suggests the market is willing to pay a higher price for each yen of profit, possibly linking that premium to its energy efficiency focus, high quality earnings and a long operating history dating back to 1924.
Peer comparisons sharpen that contrast. The same 21.1x P/E is described as expensive next to the peer group average of 16.6x and even more stretched against the JP Building industry at 12.6x, yet still judged good value versus an estimated fair P/E of 23.4x that the market could move toward if sentiment and fundamentals stay aligned.
Explore the SWS fair ratio for Daikin IndustriesLtd.
Result: Price-to-Earnings of 21.1x (ABOUT RIGHT)
Still, the weaker 3 year and 5 year total returns, along with the global exposure of Daikin IndustriesLtd to construction and capital spending cycles, could easily challenge that valuation story.
Find out about the key risks to this Daikin IndustriesLtd narrative.
Another View on Daikin IndustriesLtd’s Value
A different lens comes from the SWS DCF model. At ¥20,740, Daikin IndustriesLtd trades about 21.3% below an estimated fair value of ¥26,364.58. That points to undervaluation on cash flow assumptions, even while the current 21.1x P/E looks rich against peers. Which signal should carry more weight for you?
For readers who want to see how those cash flow assumptions are built and tested, take a closer look at the full valuation workup in our DCF model analysis. Look into how the SWS DCF model arrives at its fair value.
Simply Wall St performs a discounted cash flow (DCF) on every stock in the world every day (check out Daikin IndustriesLtd for example). We show the entire calculation in full. You can track the result in your watchlist or portfolio and be alerted when this changes, or use our stock screener to discover 17 high quality undervalued stocks. If you save a screener we even alert you when new companies match - so you never miss a potential opportunity.
Next Steps
If this mix of optimism and caution around Daikin IndustriesLtd feels familiar, move quickly and test the numbers yourself so the view is yours, not the market’s. To see what is underpinning the more optimistic angle in our work, review the 2 key rewards
Looking for more investment ideas beyond Daikin IndustriesLtd?
Round out your watchlist with a few more targeted ideas so you are not relying on a single storyline for future returns.
- Target income resilience by scanning a curated pool of higher yield opportunities through the 14 dividend fortresses.
- Hunt for quality at a discount by focusing on businesses that look underpriced on fundamentals using the 17 high quality undervalued stocks.
- Prioritise capital preservation by filtering for companies with steadier profiles through the 21 resilient stocks with low risk scores.
This article by Simply Wall St is general in nature. We provide commentary based on historical data and analyst forecasts only using an unbiased methodology and our articles are not intended to be financial advice. It does not constitute a recommendation to buy or sell any stock, and does not take account of your objectives, or your financial situation. We aim to bring you long-term focused analysis driven by fundamental data. Note that our analysis may not factor in the latest price-sensitive company announcements or qualitative material. Simply Wall St has no position in any stocks mentioned.
Have feedback on this article? Concerned about the content? Get in touch with us directly. Alternatively, email editorial-team@simplywallst.com