
Why Radian Group (RDN) Is Back In The Spotlight
Radian Group (RDN) drew fresh attention on 10 September 2026 after subsidiary Radian Guaranty made its mortgage insurance quotes available within Lender Price’s AI-driven mortgage pricing platform, which is used by a wide range of lenders.
Despite the Lender Price integration drawing fresh attention, Radian Group’s 1-month share price return is down 4.32% and the year-to-date share price return is down 2.53%, while the 3-year total shareholder return of 51.94% and 5-year total shareholder return of 84.77% point to stronger longer term momentum that recent weakness has not erased.
Scan beyond Radian Group and explore this pricing integration story by reviewing a curated 30 resilient stocks with low risk scores that may appeal if you value resilience as much as upside potential.
Radian Group now trades at a clear discount to both analyst targets and an indicated fair value, despite the recent pullback. Is that a sensible cushion for risk, or a sign the market is leaning too cautious?
Price-to-Earnings of 8.3x: Is it justified?
Radian Group looks inexpensive when judged by its P/E of 8.3x, given the last close at $35.01 and the broader signals that point to an undervalued profile compared with peers.
The P/E ratio compares what investors pay for each dollar of current earnings. For a mortgage insurance specialist such as Radian Group, that lens matters because earnings are a direct product of underwriting discipline, credit conditions, and how effectively the business prices and manages mortgage risk.
Analysts point to earnings that are forecast to grow 11.79% per year, even after a year in which profit fell 12.2% and margins compressed from 53.1% to 33.9%. That mix suggests the market could be pricing in recent profit pressure more heavily than the outlook, especially since the stock is trading at what some view as good value relative to peers and the US Diversified Financial industry. The current 8.3x P/E is materially lower than both the estimated fair P/E of 12.5x and the industry average of 17.2x, levels that the market could potentially move toward if sentiment and results align.
Compared with peers on a narrower set of similar companies, Radian Group’s 8.3x P/E still points to a discount versus the 8.8x peer average, so the valuation gap is not just an industry artifact but also shows up within its closer comparison set.
Explore the SWS fair ratio for Radian Group.
Result: Price-to-Earnings of 8.3x (UNDERVALUED)
Still, Radian Group’s story could be knocked off course if US housing activity softens sharply or if mortgage credit losses turn out higher than expected.
Find out about the key risks to this Radian Group narrative.
Another View on Radian Group’s Value
The P/E story on Radian Group looks compelling, yet the SWS DCF model points to something even starker. With a current share price of $35.01 against an estimated future cash flow value of $113.13, the stock screens as heavily undervalued. Is that a genuine opportunity or just model optimism meeting market caution?
Look into how the SWS DCF model arrives at its fair value.
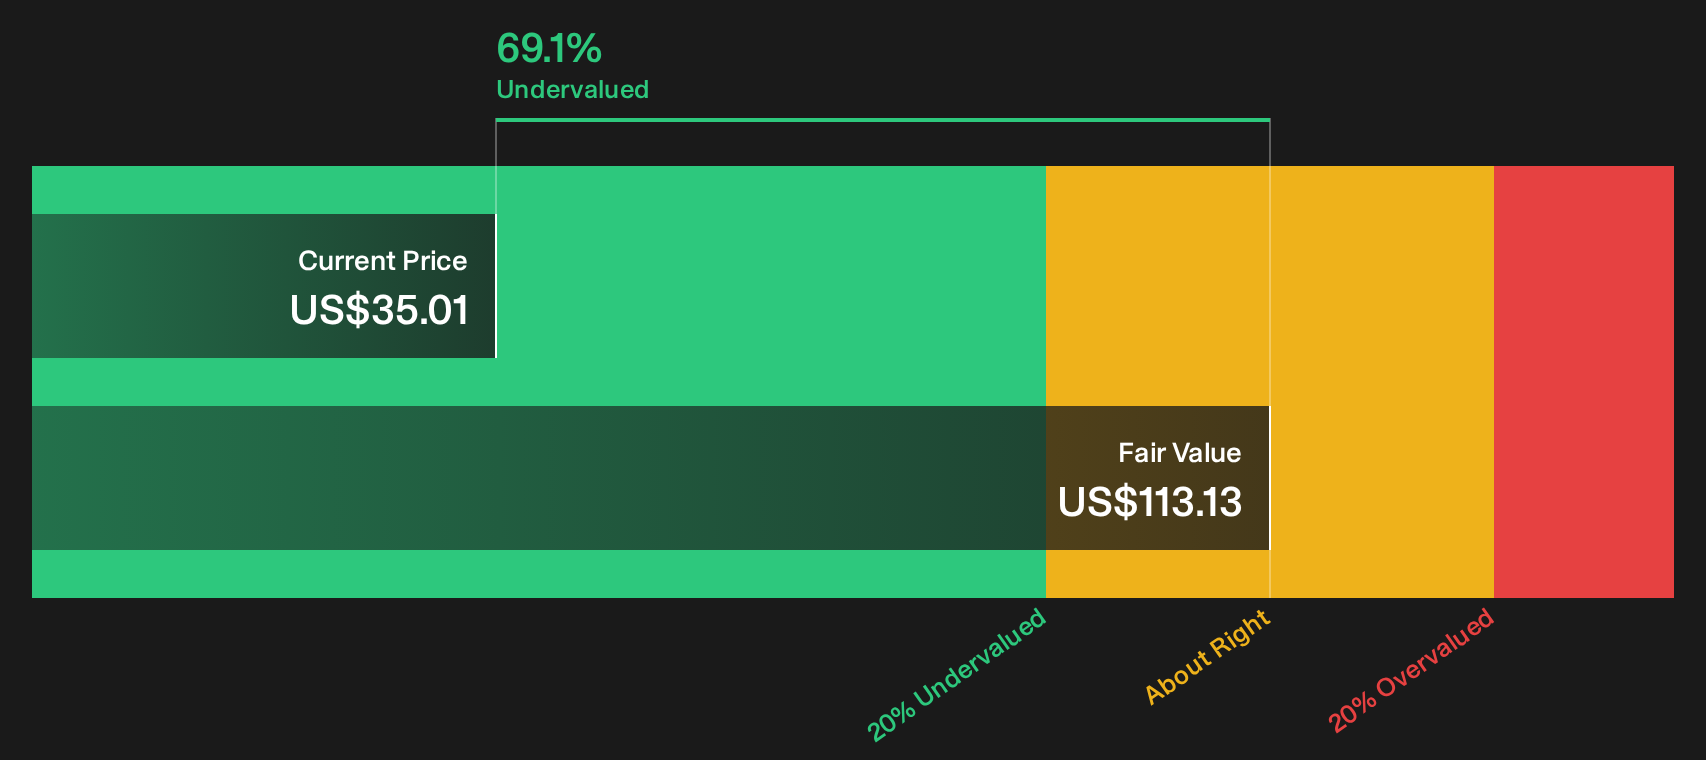
Simply Wall St performs a discounted cash flow (DCF) on every stock in the world every day (check out Radian Group for example). We show the entire calculation in full. You can track the result in your watchlist or portfolio and be alerted when this changes, or use our stock screener to discover 35 high quality undervalued stocks. If you save a screener we even alert you when new companies match - so you never miss a potential opportunity.
Next Steps
Clear value signals and mixed sentiment can sit side by side, so move quickly on your own homework and consider both sides of the story. To see the full balance of concerns and potential upside, review the 5 key rewards and 1 important warning sign
Looking for more Radian Group investment ideas?
If Radian Group has sharpened your attention on value and risk, cast the net wider with a few focused stock shortlists built from clear, fundamentals based criteria.
- Target resilient balance sheets and steady operations by scanning a list of solid balance sheet and fundamentals (23 results) that keeps financial strength front and center.
- Hunt for potential mispricings by reviewing a carefully filtered 35 high quality undervalued stocks that aligns low prices with solid underlying business quality.
- Spot potential cash return engines by studying a 7 dividend fortresses that filters for higher yields backed by fundamentals rather than pure headline payouts.
This article by Simply Wall St is general in nature. We provide commentary based on historical data and analyst forecasts only using an unbiased methodology and our articles are not intended to be financial advice. It does not constitute a recommendation to buy or sell any stock, and does not take account of your objectives, or your financial situation. We aim to bring you long-term focused analysis driven by fundamental data. Note that our analysis may not factor in the latest price-sensitive company announcements or qualitative material. Simply Wall St has no position in any stocks mentioned.
Have feedback on this article? Concerned about the content? Get in touch with us directly. Alternatively, email editorial-team@simplywallst.com