
Kewpie (TSE:2809) Dropped, What Is Driving Attention Now?
Kewpie (TSE:2809) has drawn attention after recent share price weakness, with the stock down 3.4% on the day and about 7.4% over the past month as trading interest shifts.
For context, Kewpie’s 30 day share price return is down 7.4%, yet the 90 day share price return is up 7.1% and the 1 year total shareholder return is 8.5%. This points to fading short term momentum on top of a much stronger multi year total shareholder return profile, including a 3 year total shareholder return of 93.4% and a 5 year total shareholder return of 74.3% that reflects both price moves and reinvested dividends.
Scan beyond Kewpie’s recent pullback and compare it with hand picked consumer staples on the 17 high quality undervalued stocks that pair resilient cash flows with balance sheets built to handle rough patches.
Kewpie now trades at ¥4,440 while analyst targets and intrinsic estimates sit noticeably higher. The real question is how much of that valuation gap you think is justified.
Price-to-Earnings of 24.2x: Is it justified?
Kewpie screens as expensive on headline metrics, with a P/E of 24.2x at a share price of ¥4,440 compared with peers and sector averages that trade on materially lower earnings multiples.
The P/E ratio compares what investors pay today for each unit of current earnings. For a food manufacturer like Kewpie it often reflects how confident the market feels about the durability of its cash generation and future profit path. For a mature consumer staples group, a higher multiple usually implies investors are comfortable with the quality of earnings and the resilience of its product portfolio across economic cycles.
Context matters for that premium. Kewpie has high quality earnings and earnings have grown by 13.8% per year over the past 5 years, and earnings are forecast to grow 7.74% per year with revenue growth of 3.6% per year. That said, the latest year brought a 10.1% earnings decline, profit margins moved from 5.6% to 4.8%, earnings and revenue are both forecast to grow slower than the broader JP market, and Return on Equity is currently a low 8.1% with expectations of 9.4% in three years time. Against that backdrop, paying a premium P/E of 24.2x over the estimated fair P/E of 21.7x suggests investors are already assigning a richer price than the level the market could move towards if sentiment cools.
Compared with the JP Food industry, Kewpie trades at a materially higher earnings multiple than both the sector average of 16.8x and the peer average of 17.8x. This points to a clear valuation premium rather than a discount.
Explore the SWS fair ratio for Kewpie.
Result: Price-to-Earnings of 24.2x (OVERVALUED)
Still, Kewpie’s premium P/E can quickly look stretched if earnings forecasts soften or if consumer staples as a group see valuation multiples compress.
Find out about the key risks to this Kewpie narrative.
Another View on Kewpie’s Valuation
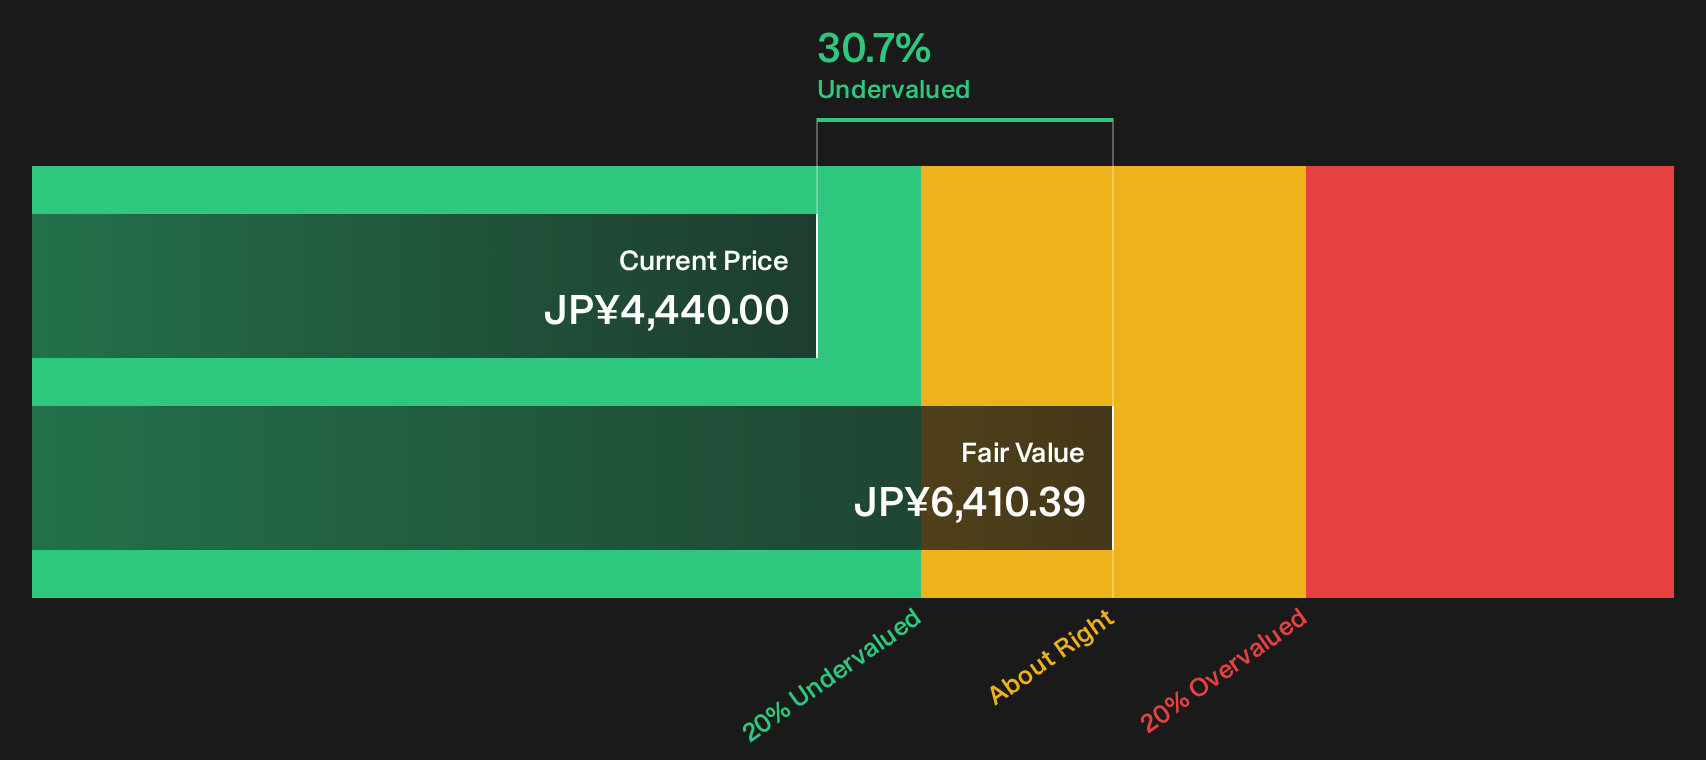
The P/E screen paints Kewpie as expensive, yet the SWS DCF model tells a different story. At ¥4,440 the shares trade about 30.7% below an estimated future cash flow value of ¥6,410.39. That points to undervaluation. Which signal do you trust more when the two disagree?
Look into how the SWS DCF model arrives at its fair value.
Simply Wall St performs a discounted cash flow (DCF) on every stock in the world every day (check out Kewpie for example). We show the entire calculation in full. You can track the result in your watchlist or portfolio and be alerted when this changes, or use our stock screener to discover 17 high quality undervalued stocks. If you save a screener we even alert you when new companies match - so you never miss a potential opportunity.
Next Steps
If the mixed signals around Kewpie leave you undecided, treat that as a prompt to check the underlying data yourself and move quickly while sentiment is still in flux. To understand why some investors are optimistic about its potential rewards, take a closer look at the 2 key rewards.
Looking for more ideas beyond Kewpie?
Do not stop with Kewpie. Use this pullback as a reason to broaden your watchlist and line up the next opportunities before the crowd moves in.
- Target dependable value candidates and stress test your conviction with the 17 high quality undervalued stocks that filters for quality plus sensible pricing.
- Prioritise resilience by scanning the list of solid balance sheet and fundamentals (21 results) so you focus on businesses built to handle tougher conditions.
- Get ahead of the herd and review the 75 high quality undiscovered gems that surfaces lesser known companies with strong underlying fundamentals.
This article by Simply Wall St is general in nature. We provide commentary based on historical data and analyst forecasts only using an unbiased methodology and our articles are not intended to be financial advice. It does not constitute a recommendation to buy or sell any stock, and does not take account of your objectives, or your financial situation. We aim to bring you long-term focused analysis driven by fundamental data. Note that our analysis may not factor in the latest price-sensitive company announcements or qualitative material. Simply Wall St has no position in any stocks mentioned.
Have feedback on this article? Concerned about the content? Get in touch with us directly. Alternatively, email editorial-team@simplywallst.com