
Grain/Livestock Overview
Grain/Livestock Overview
(ZSX26) (ZCZ26) (ZWZ26) (LEV26) (GFV26) (HEV26)
You only have to look at the charts to see how many times either a Fibonacci retracement, or major Gann square has turned the market to understand how important these levels are.
We put out a new video titled,
ONE44 Analytics, How To Find The Long Term Fibonacci Retracements, New Video
In this video we show you how to get the longer term Fibonacci retracements even when the current contract is at its ATH.
Overview
The long term levels remain key to Soybeans, Corn and Wheat.
The Soybean market remains very strong, however they have a long term 61.8% level above that could end the rally for the time being. As always we will watch all the retracements on any setback to see just how weak, or strong the market is regardless of the longer term targets.
Corn has now traded at the long term 38.2% level for over three weeks, this also can be the level that ends the rally for now.
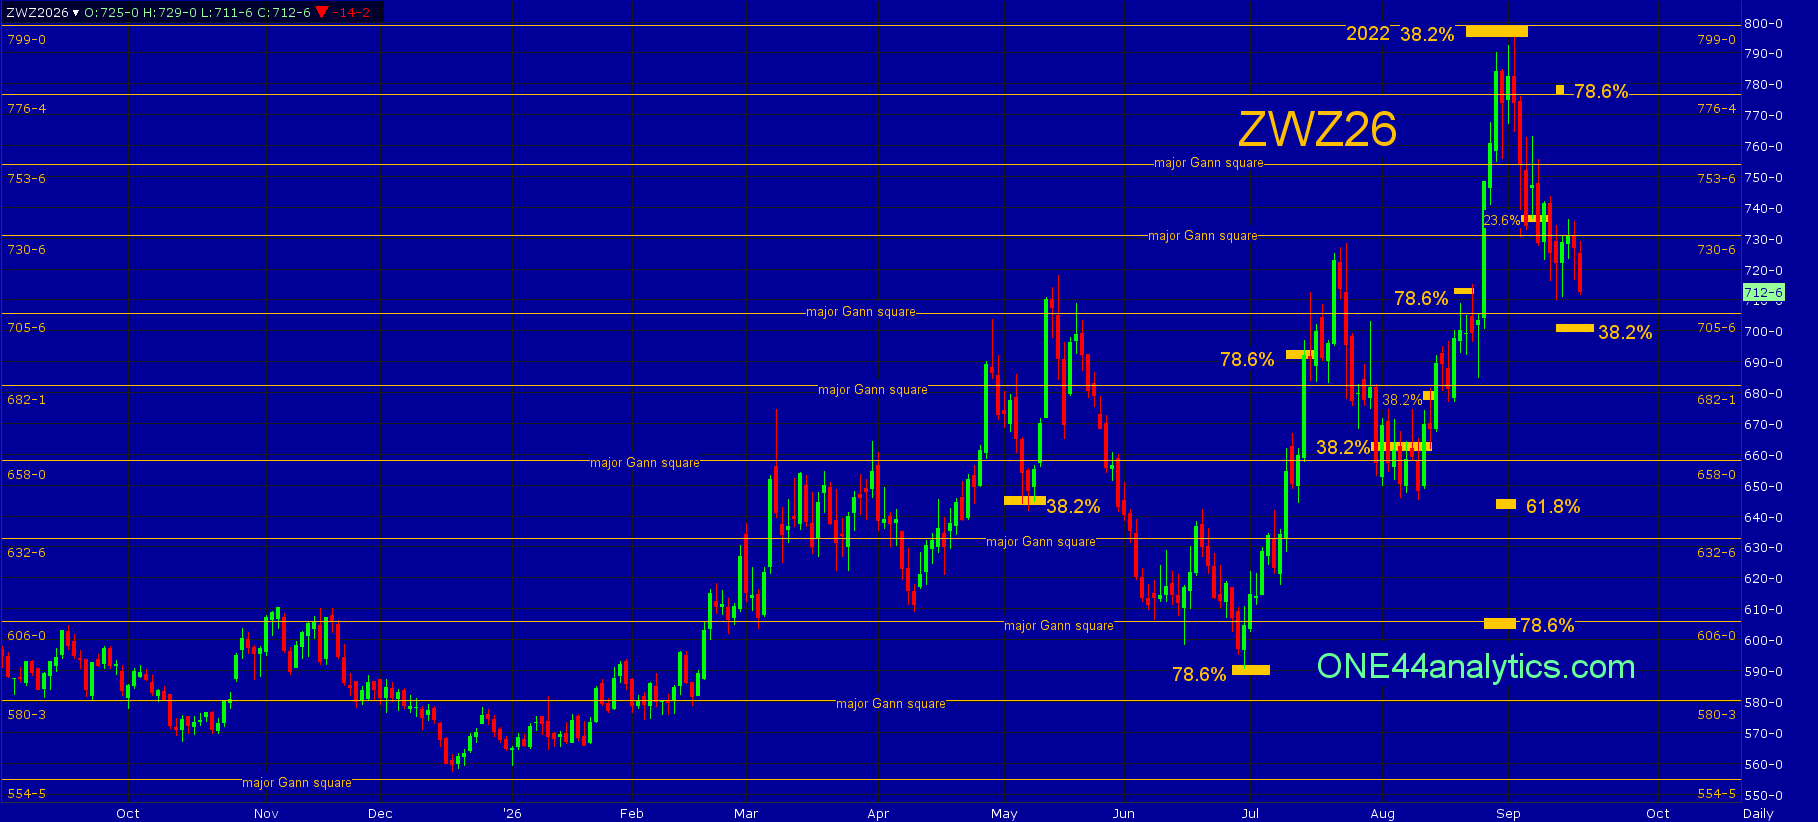
Wheat has already reacted to the long term 38.2% level above at 799.00 and we are watching the key levels below to see if this is a longer term top that has been put in.
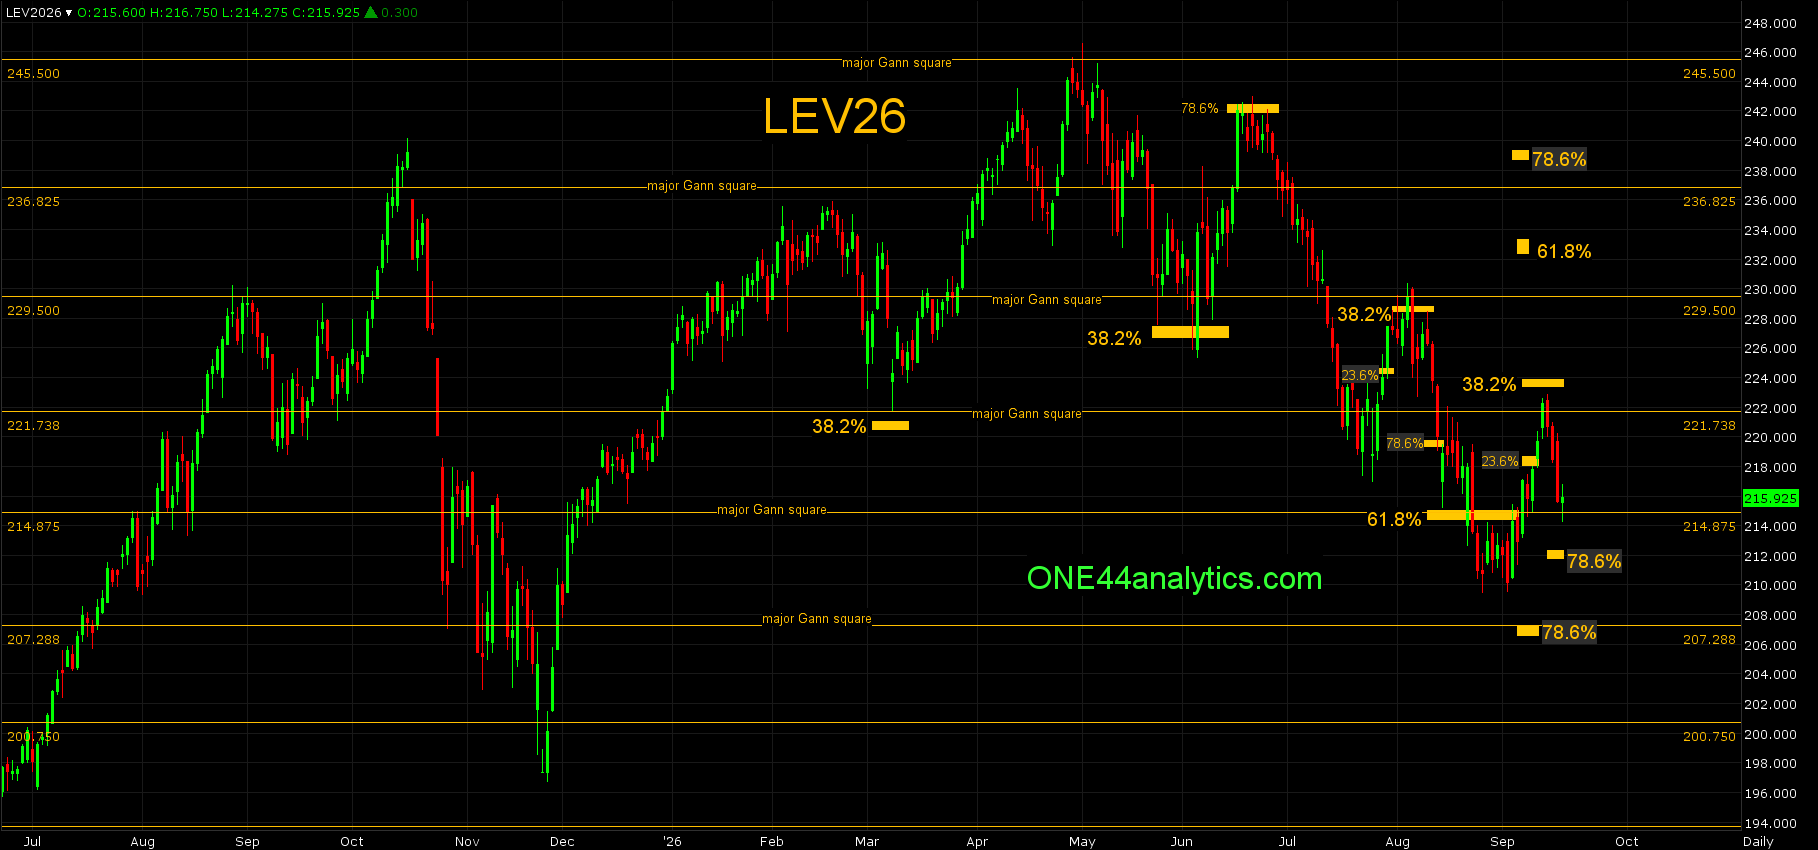
Live Cattle and Feeders failed to get two closes above their 38.2% retracements and that keeps the trend negative for now and new lows possible.
Lean Hogs failed to get above 38.2% on the last rally and have now gone on to new lows, we are looking for the 78.6% retracements below.
Wheat
December
From last week,
Yesterday closed below the 737.00 (23.6%) swing point for the week, we will now see if it gets another close below it today to add to the idea of a longer term top being in after failing to get above the long term 38.2% level back to the 2022 high. This will again be the key level for the week. Getting right back above it can send it right back to retest the high.
Use 737.00 as the swing point for the week again.
The break from the long term 38.2% level continues and all of the closes were below the 737.00 (23.6%) swing point for the week and the 730.75 major Gann square and this will be the key level for the week.
Use 730.75 as the swing point for the week.
Above it, the short term target is 78.6% back to the 9/2/26 high at 776.50, this is also a major Gann square. Being unable to make a new high in this area can cause a sharp setback. With a failure to turn lower from there...
Below it, the short term target is 38.2% of the same move at 702.00, this is the level that needs to hold to keep the short term trend positive. The longer term target is...
Livestock
Cattle
October
From last week,
The week's high is just short of 23.6% at 218.00 and this will be the key level for the week. If this is all it can rally it keeps the trend extremely negative and a new low can quickly follow.
Use 218.00 as the swing point for the week.
Above it, the short term target is 223.50, this is 38.2% back to the 5/1/26 high and the level that it needs to stay below to keep the long term trend negative. The longer...
This week's high was just short of the short term target of 38.2% back to the contract high at 223.50, this keeps the long term trend negative and it will be the key level for the week.
Use 223.50 as the swing point for the week.
Above it, turns the trend positive again and the short term target is the 229.50 major Gann square. The longer term target is 61.8% back to the contract high at 232.40. The long term...
Below it, the short term target is 78.6% back to the 8/26/26 low at 212.30, a failure to make a new low in this area can be the start of the next bull move per the ONE44 78.6% rule. The longer term target is 78.6% of the contract high and low at 207.28, this is also a major Gann square. A failure...
ONE44 Analytics where the analysis is concise and to the point
Our goal is to not only give you actionable information, but to help you understand why we think this is happening based on pure price analysis with Fibonacci retracements, that we believe are the underlying structure of all markets and Gann squares.
If you like this type of analysis and trade the Grain/Livestock futures you can become a Premium Member.
You can also follow us on YouTube for more examples of how to use the Fibonacci retracements with the ONE44 rules and guidelines.
Sign up for our Free newsletter here.
FULL RISK DISCLOSURE: Futures trading contains substantial risk and is not for every investor. An investor could potentially lose all or more than the initial investment. Commission Rule 4.41(b)(1)(I) hypothetical or simulated performance results have certain inherent limitations. Unlike an actual performance record, simulated results do not represent actual trading. Also, since the trades have not actually been executed, the results may have under- or over-compensated for the impact, if any, of certain market factors, such as lack of liquidity. Simulated trading programs in general are also subject to the fact that they are designed with the benefit of hindsight. No representation is being made that any account will or is likely to achieve profits or losses similar to those shown. Past performance is not necessarily indicative of future results.