
YONEX (TSE:7906) Weighs A Bigger India Stake, Is The Stock Undervalued?
YONEX (TSE:7906) has called a board meeting for 16 September 2026 to consider acquiring shares in SUNRISE SPORTS (INDIA) PRIVATE LIMITED, its product distributor, and accounting for it under the equity method.
For investors watching the bigger picture, YONEX’s share price has fallen 16.44% over the past month and is down 30.19% year to date. However, the 5 year total shareholder return of 210.39% and 3 year gain of 48.79% indicate longer term momentum that this SUNRISE INDIA move could test or help revive.
Capitalize on the reset in YONEX by scanning a curated 17 high quality undervalued stocks that combine solid fundamentals with the potential for the next leg of momentum.YONEX is now weighing a deeper stake in its key Indian distributor after a sharp share price pullback. Does that combination justify buying on weakness today, or waiting for an even cleaner entry after the valuation work?
Preferred P/E of 14.9x for YONEX: Is it justified?
YONEX trades on a P/E of 14.9x, which screens as good value against several benchmarks while the share price sits at ¥2,349 after a steep pullback.
The P/E ratio compares what investors pay today for each unit of earnings that the business generates. For a sports equipment manufacturer with a long operating history and positive net income of ¥13,445, this lens gives a simple way to weigh current expectations against reported profitability.
At a high level, YONEX screens as good value on multiple fronts. The SWS DCF model estimates a future cash flow value of ¥4,166.37 per share, and the stock trades 43.6% below that figure. Its current P/E of 14.9x is also below the estimated fair P/E of 15.6x, which suggests the valuation could move closer to that level if earnings and sentiment hold together.
Compared with peers, the market is pricing YONEX more conservatively. The current P/E of 14.9x sits below the JP Leisure industry average of 15.7x and under the peer group average of 16.8x. That combination of a discount to both sector and peer multiples, plus a lower P/E than the fair ratio estimate of 15.6x, points to a market that is applying a relatively cautious earnings multiple despite the long term total return record.
Explore the SWS fair ratio for YONEX.
Result: Price-to-earnings of 14.9x (UNDERVALUED)
Still, the share price slide of 30.19% year to date and a 35.53% total return decline over 1 year show that sentiment around YONEX can shift quickly.
Find out about the key risks to this YONEX narrative.
Another View on YONEX’s value
The P/E work paints YONEX as inexpensive, yet the SWS DCF model goes further. At ¥2,349 per share against an estimated future cash flow value of ¥4,166.37, the stock screens as undervalued on cash flows as well. If both signals indicate a low valuation, what might the market be missing?
Look into how the SWS DCF model arrives at its fair value.
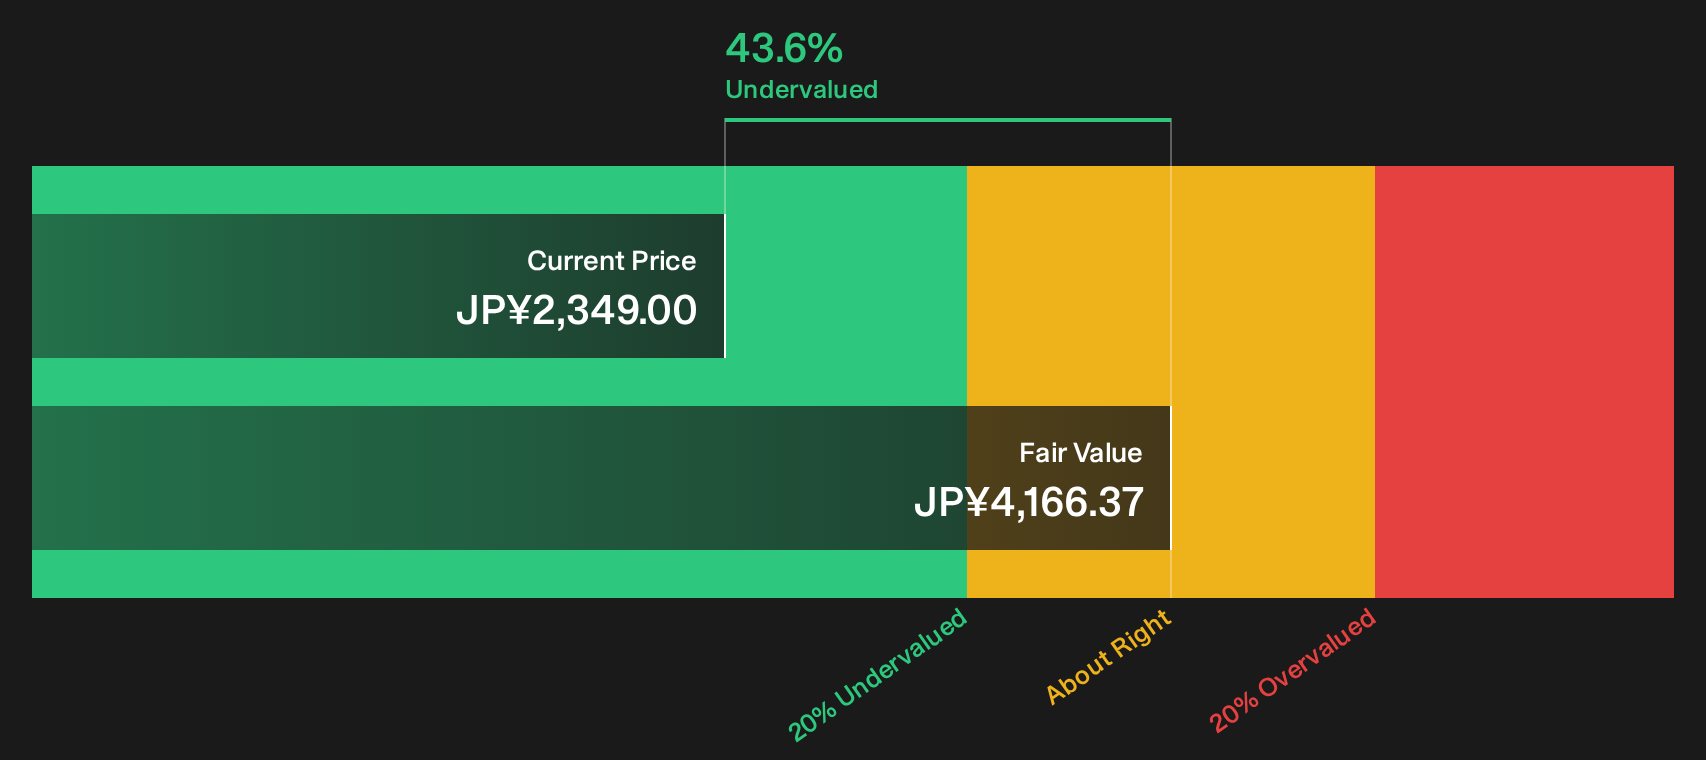
Simply Wall St performs a discounted cash flow (DCF) on every stock in the world every day (check out YONEX for example). We show the entire calculation in full. You can track the result in your watchlist or portfolio and be alerted when this changes, or use our stock screener to discover 17 high quality undervalued stocks. If you save a screener we even alert you when new companies match - so you never miss a potential opportunity.
Next Steps
Sentiment around YONEX looks mixed on the surface. Check the underlying data now and decide where you stand before the next move. To understand what investors find attractive, take a closer look at the 4 key rewards
Looking for more YONEX investment ideas beyond this story?
If YONEX has your attention, do not stop at a single ticker. Use curated screeners to line up fresh ideas before the next wave of opportunities moves.
- Target potential mispricings by scanning a curated 17 high quality undervalued stocks that highlight businesses combining solid fundamentals with room for sentiment to catch up.
- Build a steadier portfolio mix by reviewing a focused 21 resilient stocks with low risk scores that tilt toward companies with stronger resilience scores and fewer red flags.
- Hunt for future leaders early by checking a hand picked 75 high quality undiscovered gems where quality fundamentals have yet to attract wider attention.
This article by Simply Wall St is general in nature. We provide commentary based on historical data and analyst forecasts only using an unbiased methodology and our articles are not intended to be financial advice. It does not constitute a recommendation to buy or sell any stock, and does not take account of your objectives, or your financial situation. We aim to bring you long-term focused analysis driven by fundamental data. Note that our analysis may not factor in the latest price-sensitive company announcements or qualitative material. Simply Wall St has no position in any stocks mentioned.
Have feedback on this article? Concerned about the content? Get in touch with us directly. Alternatively, email editorial-team@simplywallst.com