
Fanuc (TSE:6954) Could Be 24% Above Fair Value After Its Latest Buyback
Fanuc (TSE:6954) has just wrapped up its latest share repurchase, buying 8,268,900 shares, or 0.89% of its equity, for ¥49,999.79 million under a program that closed on September 17, 2026.
Recent price action has been mixed. Fanuc’s 1-day share price return of 1.00% and 7-day gain of 2.38% come after a 90-day share price decline of 20.51%. The 1-year total shareholder return of 37.43% points to stronger longer-term momentum despite shorter-term weakness.
Scan beyond Fanuc and see how other robotics and automation players are reacting to similar buyback and momentum setups with our hand picked 95 robotics and automation stocks.
After a fresh buyback and a share price that has dropped over the past quarter yet still carries a long term gain, the real tension around Fanuc is simple: where does fair value actually sit in that gap between price and estimates?
Price-to-Earnings of 30.4x: Is it justified for Fanuc?
Fanuc currently trades on a P/E of 30.4x, which puts a rich tag on the ¥5,852 share price compared with several valuation yardsticks.
The P/E ratio compares the current share price with earnings per share. For a robotics and automation supplier like Fanuc, it reflects how much investors are willing to pay today for each unit of profit in a sector where profitability and cash generation are key reference points.
Fanuc reports high quality earnings and has grown profits by 1.5% per year over the past 5 years, with earnings forecast to rise 7.9% per year. A P/E of 30.4x in that context means the market is paying a premium for those earnings. That premium is strong compared with the JP Machinery industry average of 13.3x and also looks stretched against the peer average of 23x. Compared with an estimated fair P/E of 25.6x, the current multiple is even higher, which suggests the market could move towards that lower level if expectations cool.
Explore the SWS fair ratio for Fanuc.
Result: Price-to-Earnings of 30.4x (OVERVALUED)
Still, if demand for CNC systems or robots softens, or if Fanuc’s ¥5.46b market cap attracts richer competition, that premium valuation case could quickly weaken.
Find out about the key risks to this Fanuc narrative.
Another View on Fanuc’s Valuation
There is a second lens investors often use on Fanuc. The SWS DCF model, which prices the shares off estimated future cash flows, points to a value of ¥4,425.15 per share versus the current ¥5,852. On that measure, the stock screens as overvalued, not just richly priced.
That kind of gap can reflect optimism about earnings resilience, but it also raises a simple question for anyone holding the shares. Which signal carries more weight for you: the earnings multiple or the cash flow math from the model? Look into how the SWS DCF model arrives at its fair value.
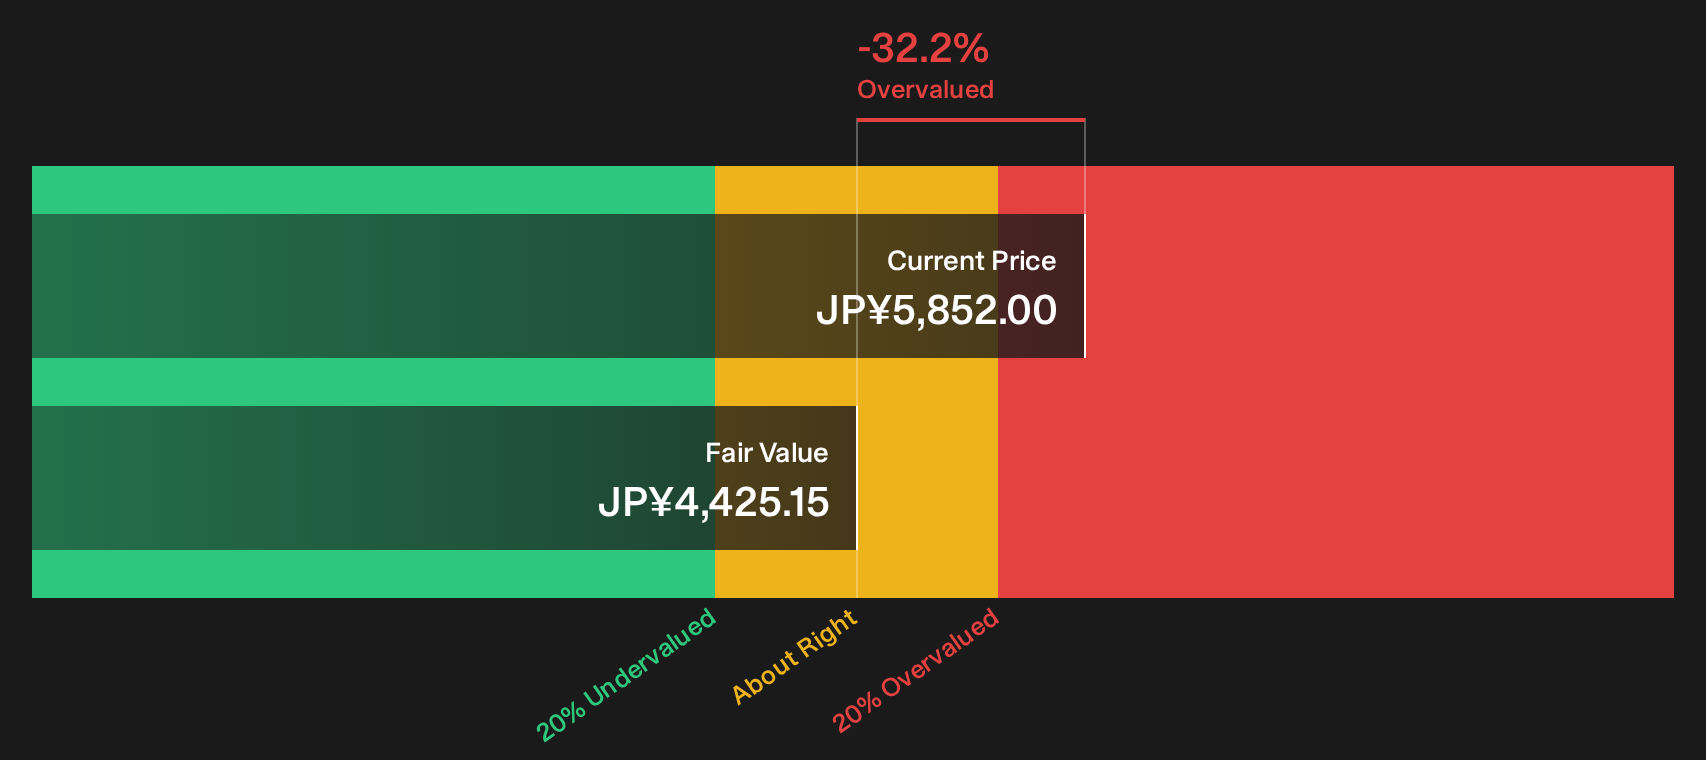
Simply Wall St performs a discounted cash flow (DCF) on every stock in the world every day (check out Fanuc for example). We show the entire calculation in full. You can track the result in your watchlist or portfolio and be alerted when this changes, or use our stock screener to discover 17 high quality undervalued stocks. If you save a screener we even alert you when new companies match - so you never miss a potential opportunity.
Next Steps
Mixed signals around Fanuc can be confusing, so use the numbers as a starting point, and move quickly to test your own thesis against the 3 key rewards and 2 important warning signs.
Want more ideas beyond Fanuc?
Do not stop your research with Fanuc. Broaden your watchlist by scanning for stocks that match clear, disciplined criteria and see what else earns a closer look.
- Target value opportunities by focusing on companies that screen as quality but potentially mispriced through the 17 high quality undervalued stocks.
- Strengthen your income stream by reviewing businesses that qualify as dependable payers within the 14 dividend fortresses.
- Prioritize resilience by checking companies that pass the tests for strong finances using the list of solid balance sheet and fundamentals (21 results).
This article by Simply Wall St is general in nature. We provide commentary based on historical data and analyst forecasts only using an unbiased methodology and our articles are not intended to be financial advice. It does not constitute a recommendation to buy or sell any stock, and does not take account of your objectives, or your financial situation. We aim to bring you long-term focused analysis driven by fundamental data. Note that our analysis may not factor in the latest price-sensitive company announcements or qualitative material. Simply Wall St has no position in any stocks mentioned.
Have feedback on this article? Concerned about the content? Get in touch with us directly. Alternatively, email editorial-team@simplywallst.com