
Terna (BIT:TRN) Could Be 5% Below Fair Value On Grid Investment Growth
Terna (BIT:TRN) has drawn investor attention after its recent share price weakness, with the stock down about 5% over the past month and roughly 8% over the past 3 months.
That recent weakness sits against a mixed backdrop for Terna. The 1-day share price return declined 0.83% and the 30-day move is down 5.15%. However, the 1-year total shareholder return of 14.77% and 5-year total shareholder return of 84.00% point to momentum that has built over a longer horizon as investors have reassessed both growth potential and risk around the grid operator’s regulated earnings profile.
Scan for other grid and infrastructure stocks that show similar long-term resilience and short-term price pressure by checking the curated 40 power grid technology and infrastructure stocks in parallel with Terna.
Terna now trades only modestly below the average analyst target, yet at a wider gap to some intrinsic value estimates after the recent pullback. Where does a fair entry point realistically fall within that spread?
Most Popular Narrative: 4.6% Undervalued
On the most followed valuation view, Terna’s fair value of about €9.77 sits slightly above the last close of €9.32, which frames the recent pullback as a modest discount rather than a major reset.
Ongoing and accelerating investments in grid modernization, digitalization, and resilience, including AI adoption and smart technologies, position Terna to capture regulated asset base growth and higher-efficiency operations, supporting long-term revenue and margin expansion.
See why 21 investors see Terna as 5% undervalued.
Result: Fair Value of €9.77 (UNDERVALUED)
Still, Terna’s heavy capex plans and reliance on regulated earnings leave the story vulnerable if project returns lag or if future tariff rules become less generous.
Find out about the key risks to this Terna narrative.
Another View: Terna Through The DCF Lens
The narrative fair value for Terna of about €9.77 suggests a modest 4.6% undervaluation, yet the Simply Wall St DCF model points the other way. In that cash flow view, the share price of about €9.32 sits above an estimated value of roughly €7.78, which flags Terna as overvalued instead. Which story do you think fits the risk you are willing to take?
Look into how the SWS DCF model arrives at its fair value.
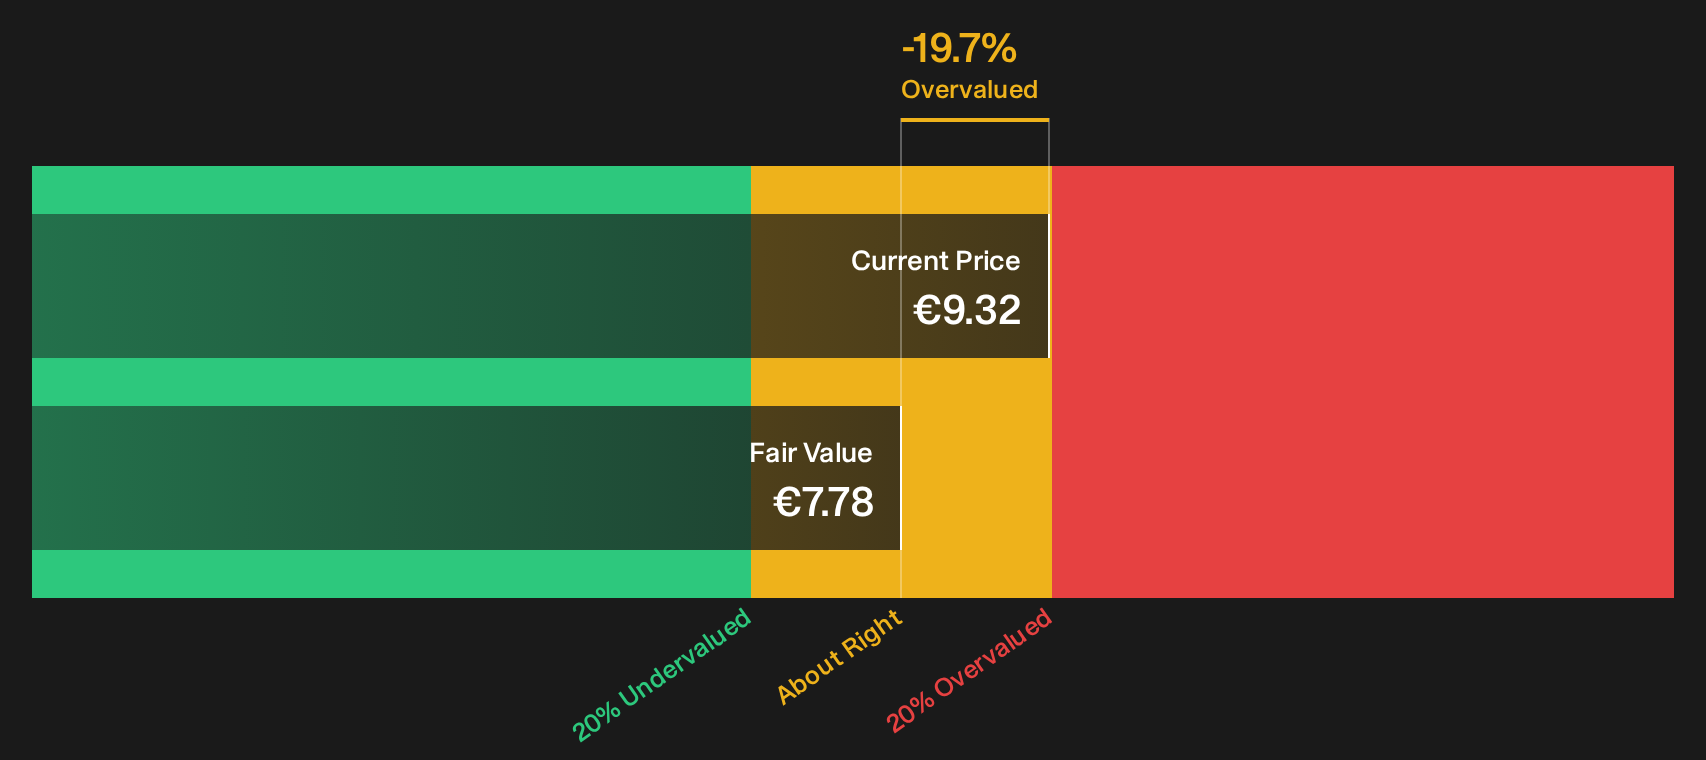
Simply Wall St performs a discounted cash flow (DCF) on every stock in the world every day (check out Terna for example). We show the entire calculation in full. You can track the result in your watchlist or portfolio and be alerted when this changes, or use our stock screener to discover 170 high quality undervalued stocks. If you save a screener we even alert you when new companies match - so you never miss a potential opportunity.
Next Steps
Mixed signals on Terna’s value and risk profile make this a judgment call, so move fast on the data and shape your own stance by weighing the 3 key rewards and 2 important warning signs.
Looking for more investment ideas beyond Terna?
Do not stop with Terna. Use the Simply Wall St screener to spot fresh opportunities that fit your style before other investors move first.
- Target potential mispricing by scanning a curated group of companies that combine quality fundamentals with attractive valuations through the 170 high quality undervalued stocks.
- Prioritise resilience by focusing on businesses that carry robust finances and disciplined balance sheets using the list of solid balance sheet and fundamentals (197 results).
- Hunt for under-the-radar opportunities by checking a carefully filtered pool of strong fundamental stories via the 616 high quality undiscovered gems.
This article by Simply Wall St is general in nature. We provide commentary based on historical data and analyst forecasts only using an unbiased methodology and our articles are not intended to be financial advice. It does not constitute a recommendation to buy or sell any stock, and does not take account of your objectives, or your financial situation. We aim to bring you long-term focused analysis driven by fundamental data. Note that our analysis may not factor in the latest price-sensitive company announcements or qualitative material. Simply Wall St has no position in any stocks mentioned.
Have feedback on this article? Concerned about the content? Get in touch with us directly. Alternatively, email editorial-team@simplywallst.com