
ZCCM Investments Holdings (LUSE:ZCCM) Stock Rallies Into Heavy Losses And Valuation Doubts
The market came into this ZCCM Investments Holdings release with the share price up 37% over three months, then paused at €4.22 as the new numbers hit. Traders had to square that optimism with another heavy loss, with trailing twelve month net income from continuing operations running at a deficit of 4,151.713 million ZMW. The real story sits on the balance sheet and valuation strain. A P/B of 0.4x against higher peer and sector multiples now collides with a discounted cash flow estimate of just €0.09, leaving sentiment caught between asset value and cash flow risk.
Is ZCCM Investments Holdings trading at a genuine discount on assets, or just flashing a misleading value signal? See how the current share price compares with our independent valuation analysis for ZCCM Investments Holdings
H1 2026 Earnings Summary
- Total Revenue (H1 2026 vs H1 2025): 57.821 million ZMW vs 44.087 million ZMW (increase of 31.1%)
- Net Income/Loss (Excl. Extra Items, H1 2026 vs H1 2025): loss of 89.86 million ZMW vs loss of 848.325 million ZMW (loss narrowed by 89.4%)
- Basic EPS (H1 2026 vs H1 2025): loss of 0.56 ZMW per share vs loss of 5.271823 ZMW per share (loss per share reduced by 89.4%)
- Copper Production (H1 2026 vs H1 2025): not disclosed for H1 2026 vs 8,858.0 tons in H1 2025 (current period volume not reported in the dataset)
Prefer clean charts instead of paragraphs of dense figures and footnotes? View ZCCM Investments Holdings' full financial profile, including an at a glance focus on valuation, in the interactive company report for ZCCM Investments Holdings.
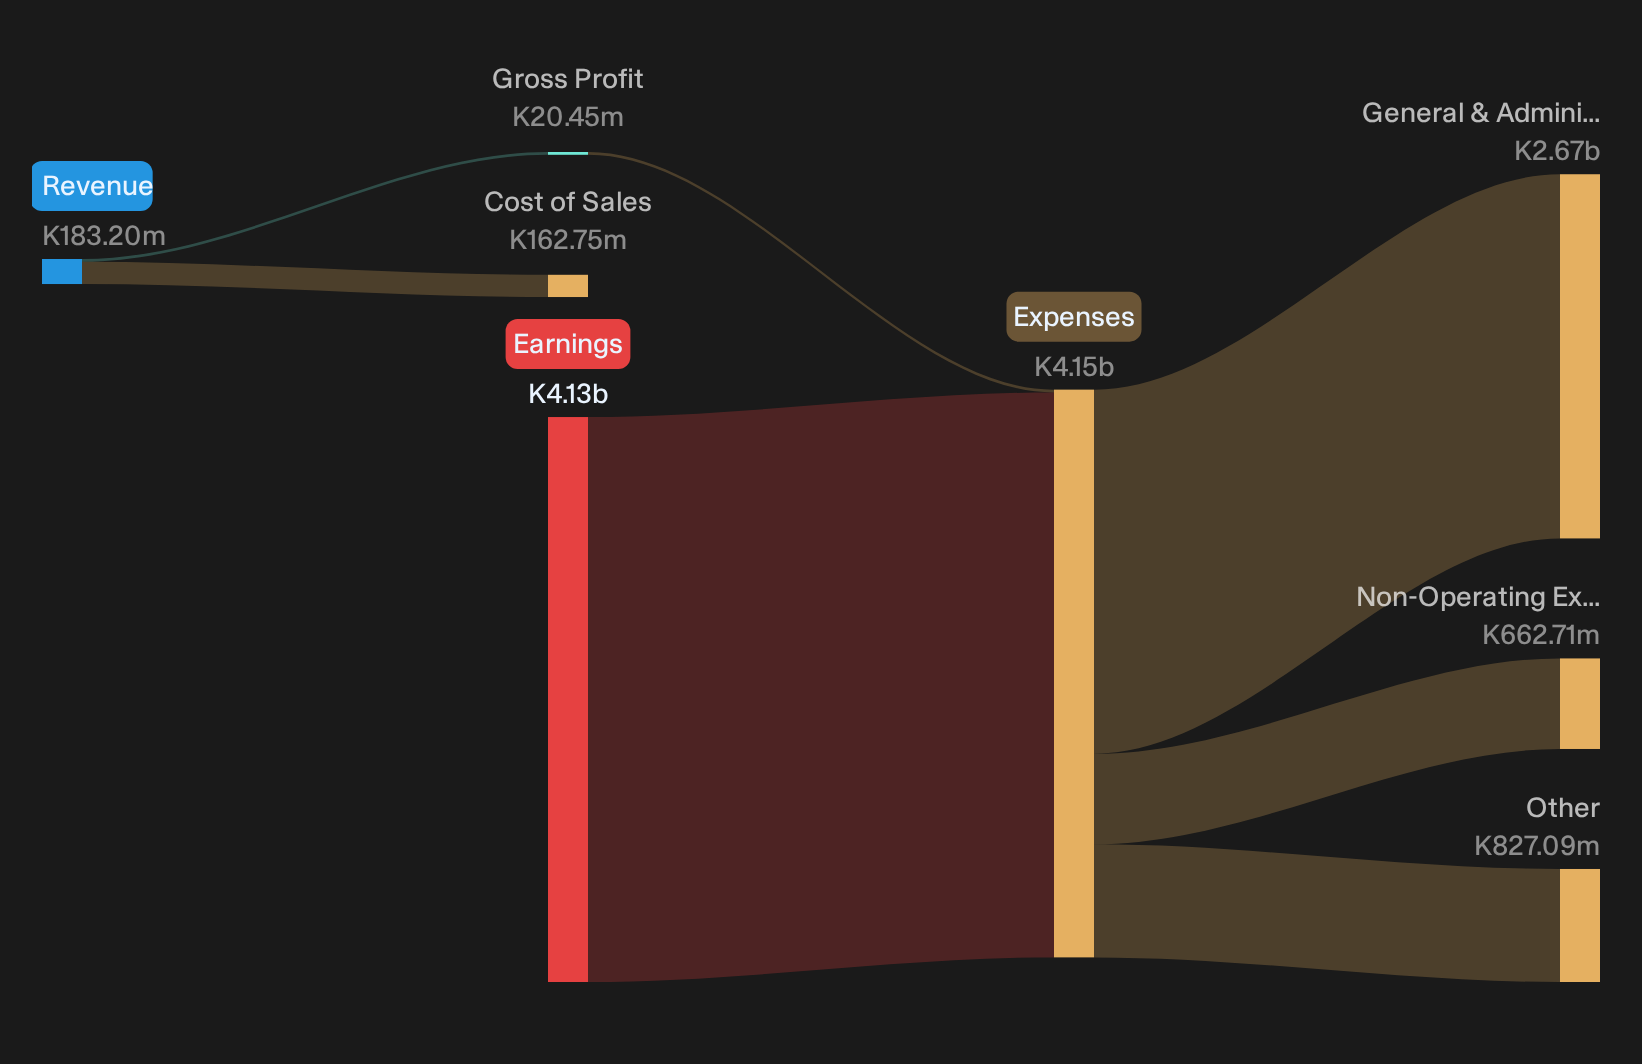
ZCCM Investments Holdings: Green Shoots In The Numbers
For anyone leaning bullish on ZCCM Investments Holdings, the latest half year offers some support. Revenue of 57.821 million ZMW versus 44.087 million ZMW points to a top line that is moving in the right direction. The loss excluding extra items narrowed from 848.325 million ZMW to 89.86 million ZMW. That is a large step toward break even. Earnings per share tell the same story, with the loss per share shrinking from 5.271823 ZMW to 0.56 ZMW.
Losses, Disclosure Gaps And The Bearish Counterpoint
The bear case for ZCCM Investments Holdings still has plenty to work with. The group remains loss making, with 89.86 million ZMW in red ink for H1 2026 and a trailing twelve month loss from continuing operations of 4,151.713 million ZMW. Copper production data for the latest half year is missing, although it was disclosed at 8,858.0 tons in H1 2025. That lack of volume visibility keeps questions open around the health of one key commodity pillar and the durability of the recent earnings improvement.
With losses still heavy and no forward earnings forecasts in the dataset, it is hard to judge whether ZCCM Investments Holdings has the balance sheet strength to endure more pain without drastic funding moves. Check the full solvency, liquidity and debt picture in the financial health analysis of ZCCM Investments Holdings stock.Stay Ahead With Simply Wall St
If ZCCM Investments Holdings looks interesting after the recent gap between asset value signals and cash flow concerns, register for free with Simply Wall St and add it to a Watchlist to track share price against fair value and watch how the story develops. After taking a position, keep your holdings organised in the Portfolio Command Center so you filter out market noise and only see the updates that matter. For longer term decisions, use the Community to see how other investors are interpreting the same data and where they agree or disagree. By spotting potential catalysts and risks early, you give yourself a better chance of staying ahead of the market rather than reacting to it late.
Seeking Alternatives Beyond ZCCM Investments Holdings?
Fresh ideas can move fast, and the most interesting stories often gain momentum before the crowd catches on. Scan under the radar for now while it matters and act now.
- Spot steady income opportunities before yields get compressed by latecomers when you review the curated 159 dividend fortresses that is built for investors who care about durability as much as payout.
- Track emerging AI momentum plays while they are still flying under most radars by scanning the focused set of 38 profitable AI stocks that aren't just burning cash that is picked for real business traction.
- Position ahead of potential copper supply stories getting fully priced by running through the hand selected 17 top copper producer stocks that highlights producers with meaningful operating footprints.
This article by Simply Wall St is general in nature. We provide commentary based on historical data and analyst forecasts only using an unbiased methodology and our articles are not intended to be financial advice. It does not constitute a recommendation to buy or sell any stock, and does not take account of your objectives, or your financial situation. We aim to bring you long-term focused analysis driven by fundamental data. Note that our analysis may not factor in the latest price-sensitive company announcements or qualitative material. Simply Wall St has no position in any stocks mentioned.
Have feedback on this article? Concerned about the content? Get in touch with us directly. Alternatively, email editorial-team@simplywallst.com