
Why Lithium Americas (TSX:LAC) Is Back In The Spotlight
Lithium Americas (TSX:LAC) is moving its Thacker Pass lithium project from planning into execution, a shift that is starting to influence how investors think about construction risk and future cash generation potential.
Recent trading suggests sentiment around Lithium Americas is tentatively improving. The stock has a 7 day share price return of 7.65%, while the 90 day share price return is down 24.78%. Together, these figures point to early momentum following a weak stretch.
Explore other lithium and resource developers that are displaying similar early momentum in our curated list of 35 best rare earth metal stocks.
Lithium Americas now has a major asset moving toward construction, but a promising project is not the same thing as a well priced stock. Is the current share price already reflecting that shift?
Price-to-Book of 0.8x: Is it justified for Lithium Americas?
On simple book value terms, Lithium Americas trades on a P/B of 0.8x, which sits well below both its peer group and the wider Canadian metals and mining space. With the last close at CA$4.22 and a market value of about CA$1.51b, the market is currently assigning a discount to the net assets on the balance sheet.
P/B compares the equity valuation of a business to its accounting book value. This is often a practical yardstick for pre revenue resource developers like Lithium Americas. It effectively asks whether investors are paying more or less than the underlying net assets, before giving credit to any future income from Thacker Pass or other projects.
This low multiple of 0.8x indicates the market is pricing Lithium Americas below the value of its stated equity, while peers trade on much richer terms. The firm is unprofitable today and reported a net loss of CA$97.196m, which can help explain some discount as investors weigh construction risk, funding mix, and the fact that earnings are not yet in place.
The comparison to others in the sector is stark. Management is working with a P/B of 0.8x, compared with a peer average of 16.5x and a Canadian metals and mining average of 2.7x. This gap signals far lower asset expectations than many similar stocks.
See what the numbers say about this price — find out in our valuation breakdown.
Result: Price-to-book of 0.8x.
Still, Lithium Americas faces real swing factors, including execution risk at Thacker Pass and the possibility that funding terms could further pressure existing shareholders.
Find out about the key risks to this Lithium Americas narrative.
Another View on Lithium Americas: Cash Flow Says Something Different
The low 0.8x P/B ratio presents Lithium Americas as inexpensive on an asset-value basis, but the SWS DCF model indicates a very different picture. At a share price of CA$4.22 versus an estimated future cash flow value of CA$0.39, the stock appears heavily overvalued on that framework. Which lens should matter more to you when Thacker Pass is still pre revenue?
Look into how the SWS DCF model arrives at its fair value.
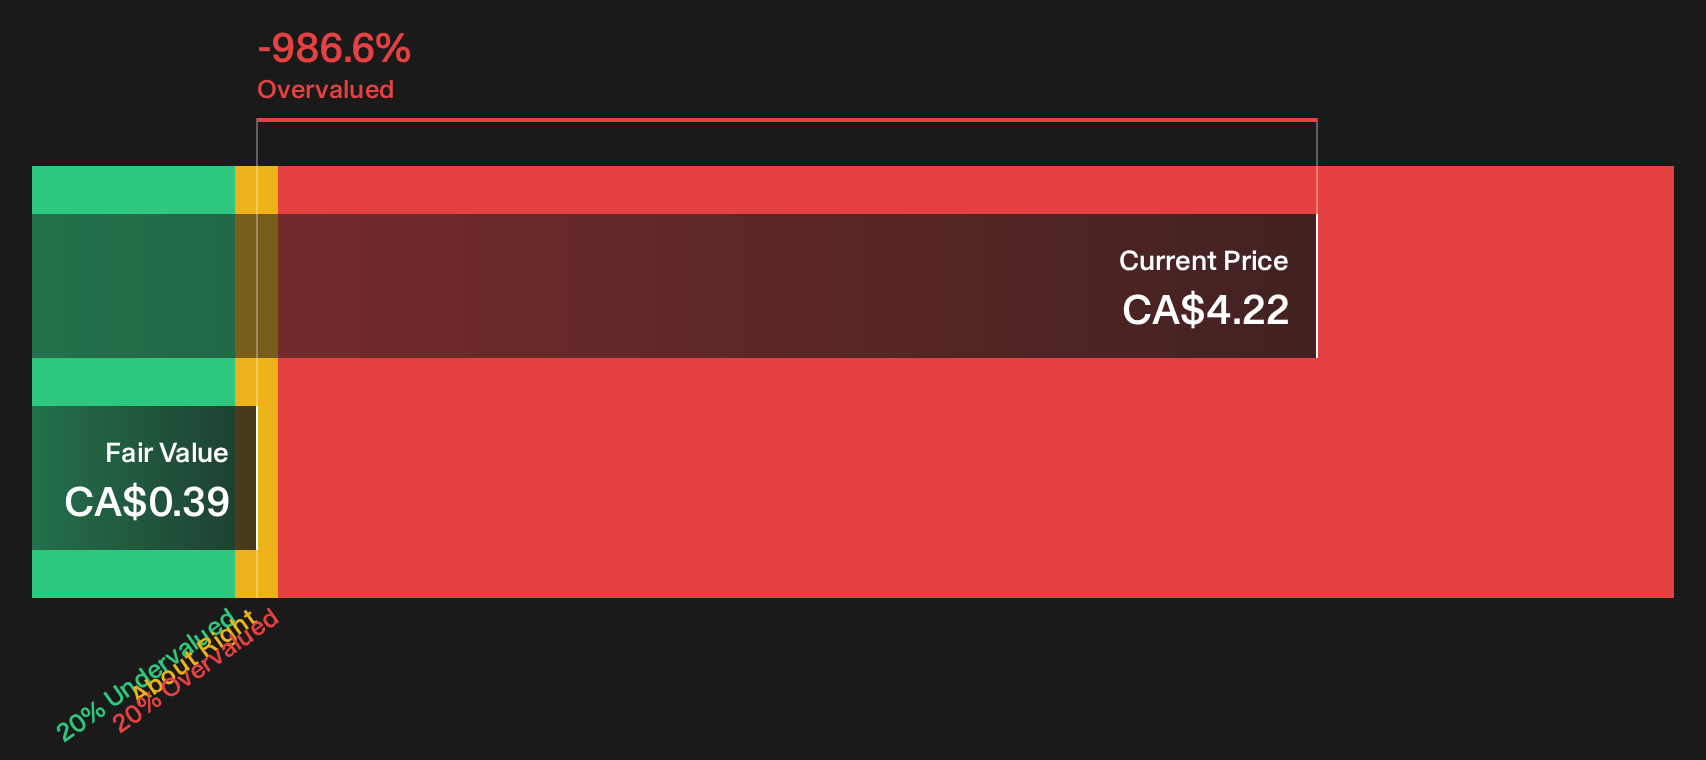
Simply Wall St performs a discounted cash flow (DCF) on every stock in the world every day (check out Lithium Americas for example). We show the entire calculation in full. You can track the result in your watchlist or portfolio and be alerted when this changes, or use our stock screener to discover 7 high quality undervalued stocks. If you save a screener we even alert you when new companies match - so you never miss a potential opportunity.
Next Steps
Mixed messages in the data can be useful. Use the valuation work on Lithium Americas as a starting point, then pressure test it against the 2 key rewards and 2 important warning signs.
Looking for more investment ideas beyond Lithium Americas?
If you focus only on Lithium Americas, you see just one angle. Broaden your watchlist with fresh ideas that align with your risk, return, and income goals.
- Target potential mispricing by scanning for companies that combine quality fundamentals with discounted valuations using our 7 high quality undervalued stocks.
- Build a more defensive core by filtering for businesses that show resilient balance sheets and solid fundamentals through the list of solid balance sheet and fundamentals (7 results).
- Spot early stories before they go mainstream by checking our 9 high quality undiscovered gems.
This article by Simply Wall St is general in nature. We provide commentary based on historical data and analyst forecasts only using an unbiased methodology and our articles are not intended to be financial advice. It does not constitute a recommendation to buy or sell any stock, and does not take account of your objectives, or your financial situation. We aim to bring you long-term focused analysis driven by fundamental data. Note that our analysis may not factor in the latest price-sensitive company announcements or qualitative material. Simply Wall St has no position in any stocks mentioned.
Have feedback on this article? Concerned about the content? Get in touch with us directly. Alternatively, email editorial-team@simplywallst.com