
Why Permian Basin Royalty Trust (PBT) Is Getting Attention Today
Permian Basin Royalty Trust (PBT) announced a higher monthly cash distribution of $0.019593 per unit, drawing fresh attention to how reduced trust expenses and shifting commodity volumes feed directly into income for unitholders.
The higher cash payout lands after a sharp pullback, with the 7-day share price return down 8.53%, even though the 90-day share price return is up 33.13% and the year-to-date share price return is 87.78%. The 5-year total shareholder return is very large, suggesting long term momentum in Permian Basin Royalty Trust remains strong even as near term sentiment cools around the latest distribution news.
Scan how Permian Basin Royalty Trust’s payout shift compares with income ideas across energy and beyond by checking the hand picked 7 dividend fortresses for yield focused investors.The recent pullback in Permian Basin Royalty Trust looks less like a verdict on its wells and more like a quick flip in mood. Is the current valuation reflecting the royalty stream, or is it more about sentiment whiplash?
Price-to-Earnings of 95x: Is it justified for Permian Basin Royalty Trust?
On simple earnings math, Permian Basin Royalty Trust looks expensive, with a P/E ratio of 95x at a last close of $33.03 while peers trade on much lower multiples.
The P/E ratio compares the current share price with net income per unit and is a quick shorthand for how much investors are paying for each dollar of earnings. For a royalty vehicle like Permian Basin Royalty Trust, which passes through income from long lived oil and gas interests, a high P/E often signals that the market is placing a premium on the stability of its royalty stream or on the perceived longevity of its underlying reserves.
Against that backdrop, the gap to both peers and the broader industry is hard to ignore. The trust is priced at 95x earnings while the peer group averages 15.6x and the US oil and gas sector sits at 13.2x. This is a very large uplift that suggests investors are accepting a steep entry price relative to comparable businesses.
See what the numbers say about this price — find out in our valuation breakdown..
Result: Price-to-Earnings of 95x (OVERVALUED)
Still, the story around Permian Basin Royalty Trust can flip quickly if oil and gas prices weaken or if higher interest rates pull income investors toward other yield options.
Find out about the key risks to this Permian Basin Royalty Trust narrative.
Another View on Permian Basin Royalty Trust’s Valuation
The rich 95x P/E tells one story about Permian Basin Royalty Trust. The SWS DCF model tells another, with an estimated future cash flow value of $7.98 per unit versus a $33.03 market price. This flags the units as expensive on this framework. Which signal do you trust more for the long haul?
Look into how the SWS DCF model arrives at its fair value.
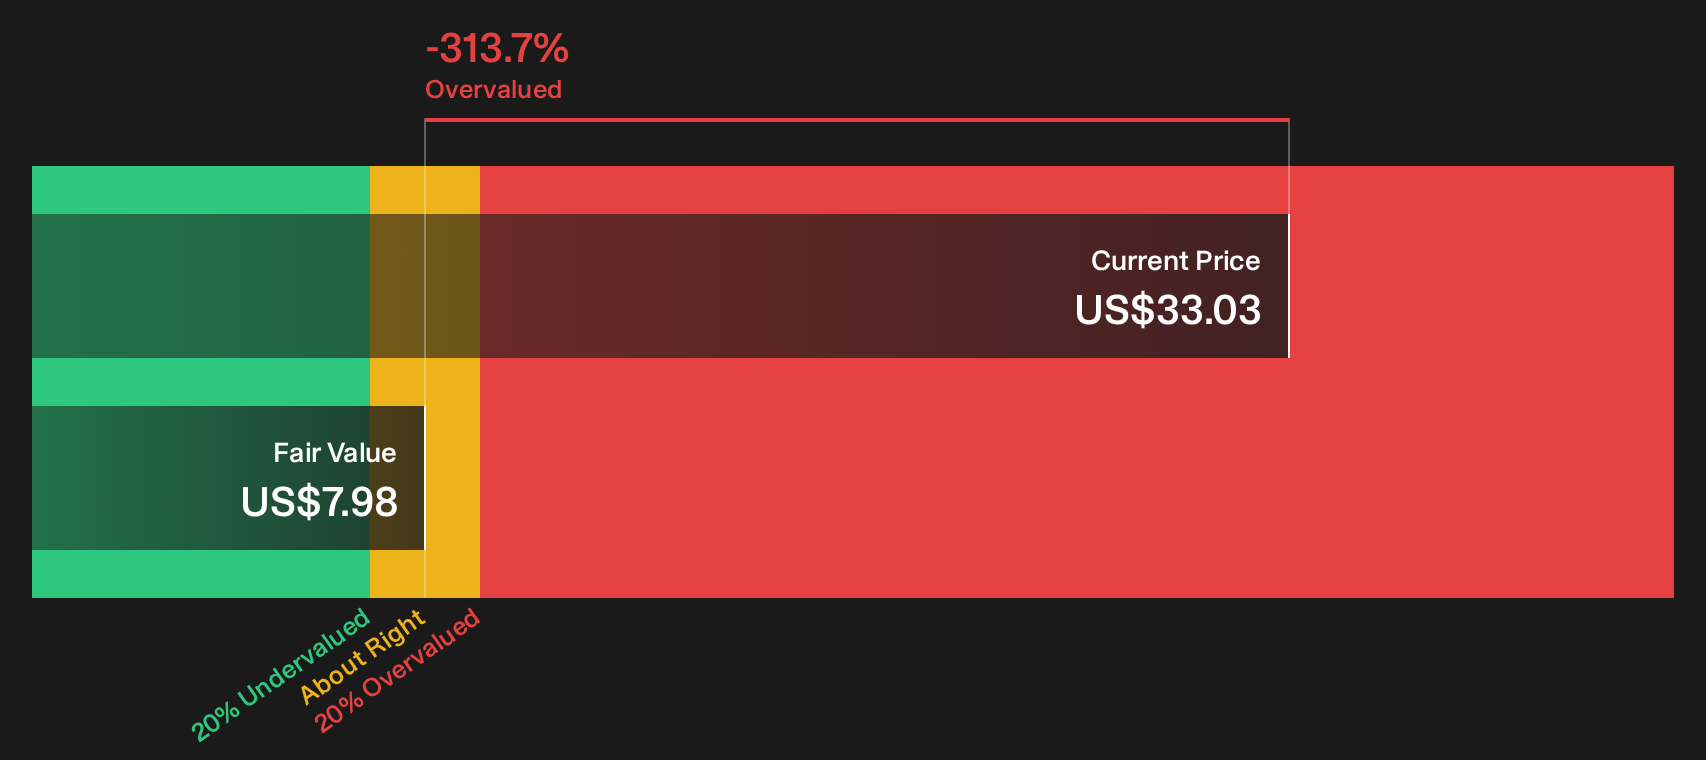
Simply Wall St performs a discounted cash flow (DCF) on every stock in the world every day (check out Permian Basin Royalty Trust for example). We show the entire calculation in full. You can track the result in your watchlist or portfolio and be alerted when this changes, or use our stock screener to discover 29 high quality undervalued stocks. If you save a screener we even alert you when new companies match - so you never miss a potential opportunity.
Next Steps
Does Permian Basin Royalty Trust look richly priced or just misunderstood at this point in the cycle? Use the full data set, move quickly before sentiment shifts again and pressure test your thesis against the 1 important warning sign.
Ready for more investment ideas beyond Permian Basin Royalty Trust?
If Permian Basin Royalty Trust has sharpened your focus on valuation and income, do not stop here. Broader opportunity sits in how you filter the market.
Skip the noise and target resilient balance sheets by using the list of solid balance sheet and fundamentals (23 results) that filters for financial strength and cleaner fundamentals.
Hunt for quality at a measured price and let the 29 high quality undervalued stocks surface ideas where fundamentals and market expectations are out of sync.
Lean into income potential and scan the 7 dividend fortresses so you do not miss yield opportunities that fit tighter risk and payout criteria.
This article by Simply Wall St is general in nature. We provide commentary based on historical data and analyst forecasts only using an unbiased methodology and our articles are not intended to be financial advice. It does not constitute a recommendation to buy or sell any stock, and does not take account of your objectives, or your financial situation. We aim to bring you long-term focused analysis driven by fundamental data. Note that our analysis may not factor in the latest price-sensitive company announcements or qualitative material. Simply Wall St has no position in any stocks mentioned.
Have feedback on this article? Concerned about the content? Get in touch with us directly. Alternatively, email editorial-team@simplywallst.com