
Lygend Resources & Technology (SEHK:2245) Prices A Share IPO, Is The Stock Still Cheap?
Lygend Resources & Technology (SEHK:2245) recently priced its A share IPO at CN¥21.23, raising about CN¥3.67b to fund hydrometallurgical residue recycling and mixed hydroxide precipitate refining projects in its nickel and battery materials operations.
The A share listing lands at a time when Lygend Resources & Technology has seen sharp short term momentum, with a 1 day share price return of 6.51% at HK$19.81 and a 90 day share price return of 76.40%. However, the year to date share price is still down 20.19%, while the 3 year total shareholder return of 198.44% and 1 year total shareholder return of 3.66% point to a longer running but bumpier journey for investors.
Scan similar nickel and battery-materials stocks showing strong price action and funding catalysts with the hand picked 17 top copper producer stocks that sit closest to Lygend Resources & Technology's current story.
Lygend Resources & Technology has just raised fresh capital, and its Hong Kong shares have moved sharply in recent months. Is this a reasonable entry point, or would it be better to wait for a cooler setup before buying in?
Price-to-Earnings of 6.3x: Is it justified?
Lygend Resources & Technology trades on a P/E of 6.3x while the last close sits at HK$19.81. That level lines up with an assessment that the shares look inexpensive compared both with similar companies and with its own cash flow profile.
The P/E ratio compares the current share price with earnings per share and gives a quick read on how much investors are paying for each unit of profit. For a producer and trader of nickel and battery materials like Lygend Resources & Technology, earnings power sits at the centre of the story, so a low multiple can matter more than for asset light sectors focused on recurring fees.
Here, the stock changes hands at 6.3x earnings compared with a peer group average of 19.4x and a Hong Kong Metals and Mining sector average of 9.7x. That is a wide gap, which signals the market is pricing Lygend Resources & Technology’s profit stream more conservatively than both its direct peers and the broader industry.
See what the numbers say about this price — find out in our valuation breakdown.
Result: Price-to-Earnings of 6.3x (UNDERVALUED)
Still, the recent 76.40% 90 day share price jump and a year to date decline of 20.19% show how quickly sentiment on Lygend Resources & Technology can change.
Find out about the key risks to this Lygend Resources & Technology narrative.
Another View on Lygend Resources & Technology’s Value
The P/E story tilts cheap, and our DCF model sketches a similar picture. At HK$19.81, Lygend Resources & Technology sits about 39.1% below an estimated future cash flow value of HK$32.51. If both earnings and cash flow lenses lean the same way, what is the market still worrying about?
Look into how the SWS DCF model arrives at its fair value.
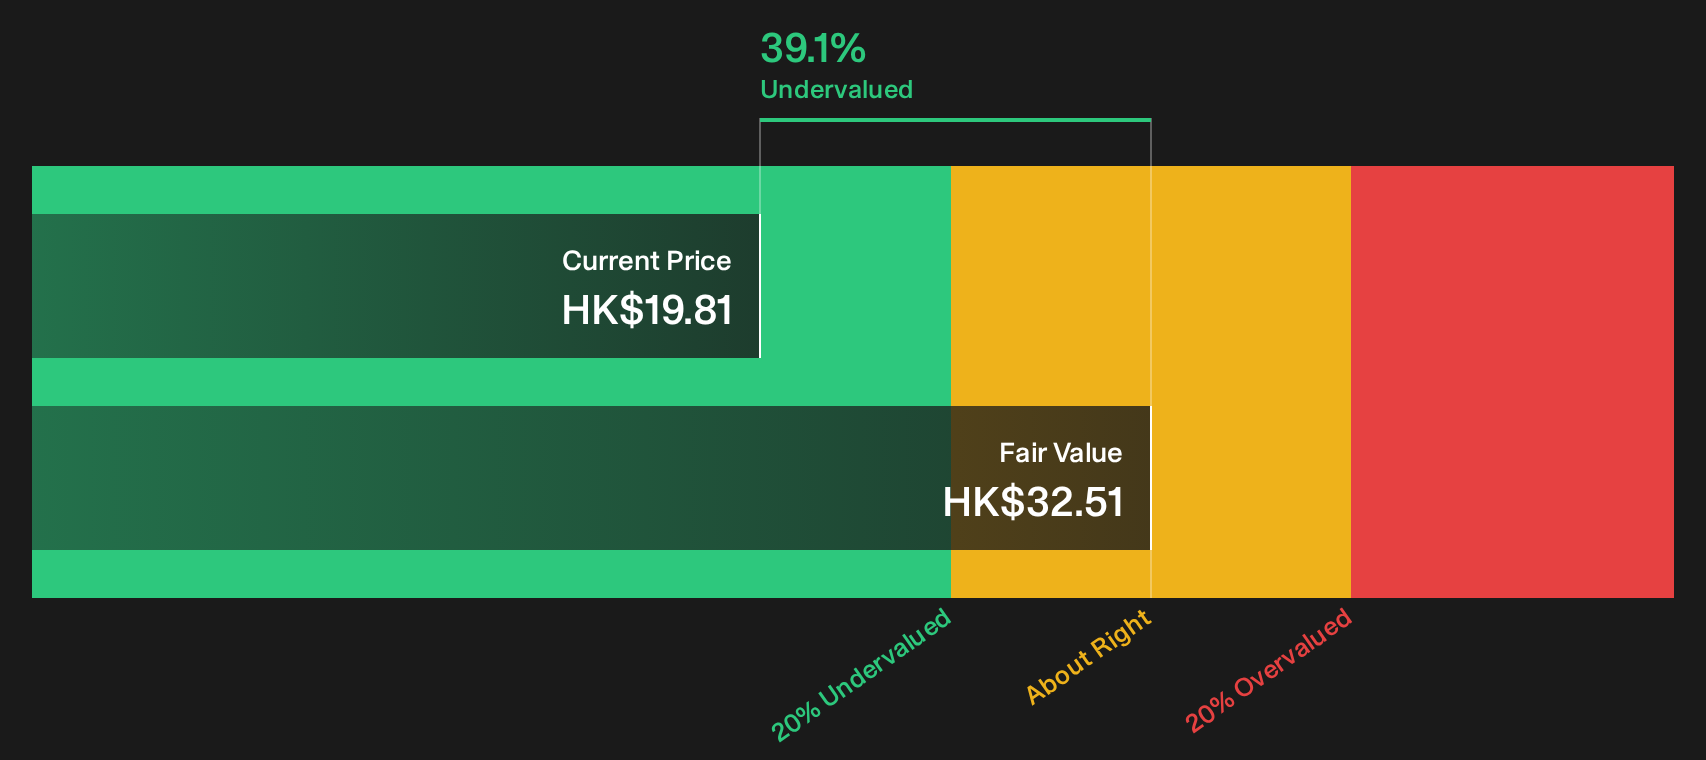
Simply Wall St performs a discounted cash flow (DCF) on every stock in the world every day (check out Lygend Resources & Technology for example). We show the entire calculation in full. You can track the result in your watchlist or portfolio and be alerted when this changes, or use our stock screener to discover 173 high quality undervalued stocks. If you save a screener we even alert you when new companies match - so you never miss a potential opportunity.
Next Steps
If the combination of a low P/E, DCF upside and recent share price swings around Lygend Resources & Technology seems mixed, consider acting promptly and testing the numbers yourself against the balance of risks and potential upsides highlighted in the 2 key rewards and 2 important warning signs.
Looking for more ideas beyond Lygend Resources & Technology?
Use the same disciplined lens you are applying to Lygend Resources & Technology to scan other opportunities, so you are not relying on a single story.
- Target potential mispricings by reviewing the 173 high quality undervalued stocks that combine quality fundamentals with share prices that have not fully reflected those characteristics yet.
- Prioritise income and stability by checking the 161 dividend fortresses that focus on stronger yields while still paying attention to business resilience.
- Reduce portfolio stress by screening for the 229 resilient stocks with low risk scores that aim to keep balance sheets and risk profiles front and centre in your decisions.
This article by Simply Wall St is general in nature. We provide commentary based on historical data and analyst forecasts only using an unbiased methodology and our articles are not intended to be financial advice. It does not constitute a recommendation to buy or sell any stock, and does not take account of your objectives, or your financial situation. We aim to bring you long-term focused analysis driven by fundamental data. Note that our analysis may not factor in the latest price-sensitive company announcements or qualitative material. Simply Wall St has no position in any stocks mentioned.
Have feedback on this article? Concerned about the content? Get in touch with us directly. Alternatively, email editorial-team@simplywallst.com