
Science Applications International (SAIC) After ORBIT Launch Narrative Puts Valuation In Focus
Science Applications International (SAIC) has recently drawn investor attention after its shares closed at US$129.69. The move comes amid steady government IT contract activity and mixed short term price performance.
Recent trading has been choppy, with the share price slipping 2.7% over the last day and 3.0% over the past week. However, Science Applications International still shows building momentum, reflected in a 19.6% three-month share price return and a 33.4% one-year total shareholder return.
Scan beyond Science Applications International and benchmark it against a hand picked list of solid balance sheet and fundamentals (23 results) to see how other contractors with steady fundamentals have been trading.
Science Applications International now trades just below the average analyst target and well under some intrinsic value estimates. Is that gap pointing to modest upside, or does it hint at a much wider fair value range ahead?
Most Popular Narrative: 9% Overvalued
According to LunaRodas, the most followed narrative on Science Applications International pegs fair value at $119.24, which sits below the recent $129.69 close and frames the current share price as slightly ahead of that reference point.
The ORBIT launch in August was the dominant communication event of the call, and it was managed as one. Reagan devoted a substantial portion of prepared remarks to ORBIT mechanics (procurement, recruiting, agentic AI in mission delivery). This was followed by Natarajan's financial architecture (six themes, margin trajectory, reinvestment split).
See why 2 investors see Science Applications International as 9% overvalued.
Result: Fair Value of $119.24 (OVERVALUED)
Still, the narrative could be knocked off course if book to bill fails to recover or if December's portfolio review underwhelms in setting clear capital allocation priorities.
Find out about the key risks to this Science Applications International narrative.
Another View On Science Applications International’s Valuation
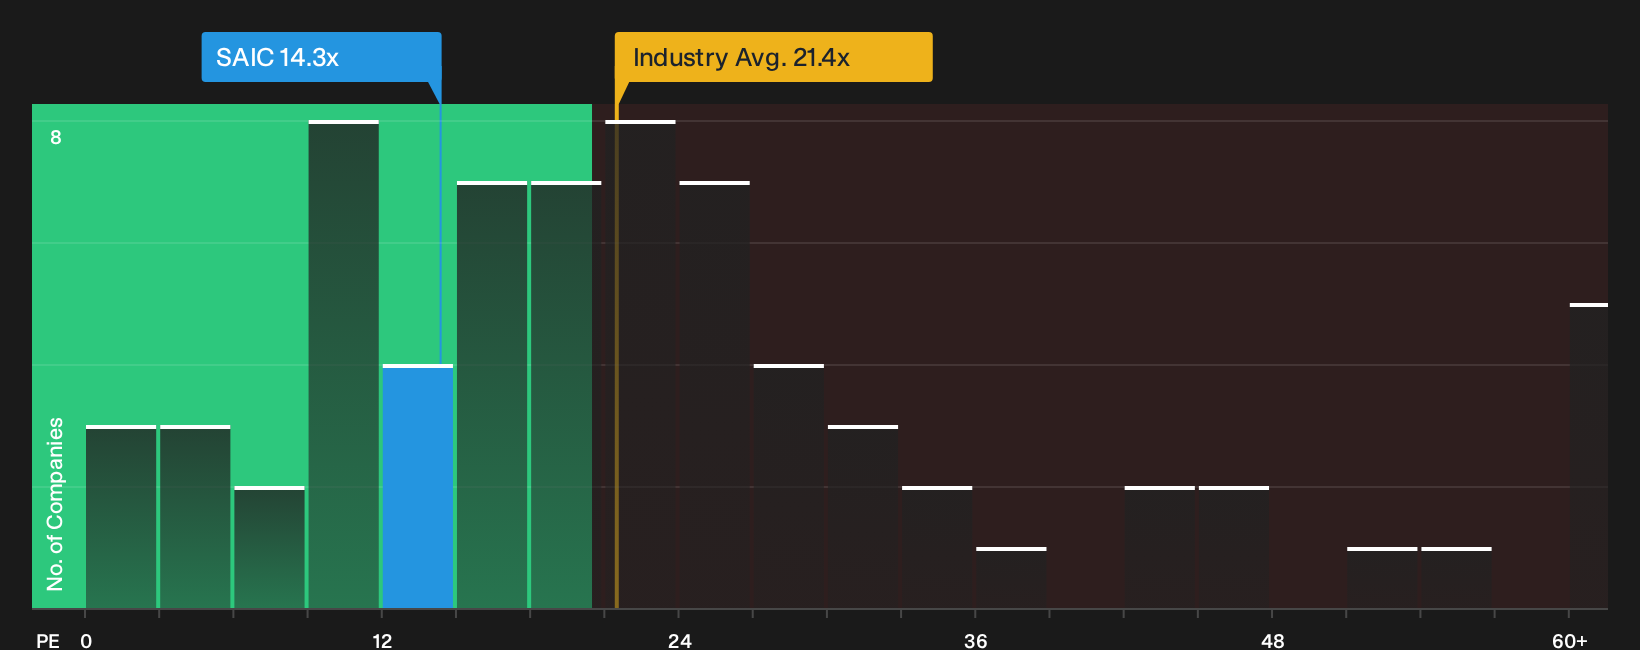
That 9% premium to a user estimated fair value is only one lens. On simple earnings multiples, Science Applications International looks cheaper than both its peers and its own fair ratio. The stock trades on a P/E of 14.3x versus a fair ratio of 17.6x, while the US Professional Services industry averages 21.6x and direct peers sit around 22.7x. For investors, that gap can either signal a margin of safety if the business delivers steadily, or it can point to a market that is pricing in real execution and balance sheet risks. Which side of that story do you think is closer to the truth?
To see how this pricing gap lines up against other contractors using a single, consistent yardstick, take a look at the See what the numbers say about this price — find out in our valuation breakdown..
Next Steps
Mixed signals on Science Applications International so far. If you want to move fast and form your own view, weigh the 3 key rewards and 1 important warning sign.
Looking for more investment ideas beyond Science Applications International?
Do not stop with Science Applications International. Broaden your watchlist with focused stock ideas built from clear filters, so you stay ahead of opportunities instead of reacting late.
- Target potential bargains by scanning a curated 29 high quality undervalued stocks that combine stronger fundamentals with appealing entry prices.
- Strengthen your income stream by reviewing a hand picked set of 7 dividend fortresses designed for investors who care about cash returns and resilience.
- Reduce portfolio stress by checking a focused 30 resilient stocks with low risk scores that highlights businesses with sturdier balance sheets and lower risk scores.
This article by Simply Wall St is general in nature. We provide commentary based on historical data and analyst forecasts only using an unbiased methodology and our articles are not intended to be financial advice. It does not constitute a recommendation to buy or sell any stock, and does not take account of your objectives, or your financial situation. We aim to bring you long-term focused analysis driven by fundamental data. Note that our analysis may not factor in the latest price-sensitive company announcements or qualitative material. Simply Wall St has no position in any stocks mentioned.
Have feedback on this article? Concerned about the content? Get in touch with us directly. Alternatively, email editorial-team@simplywallst.com