
Apollo Global Management (APO) Faces Fund Pressure, Is The Valuation Still Too Rich?
Funds linked to Apollo Global Management (APO) are under pressure after the collapse of Market Financial Solutions, with potential losses flagged in the Atlas vehicle and fresh limits on withdrawals from its flagship private credit fund.
Recent headlines around withdrawals and fund exposures come against a softer tape for Apollo Global Management, with the share price down 15.2% year to date and roughly 6.4% over the past month, even as 3-year total shareholder return sits near 45% and 5-year total shareholder return is about 120%. This signals long-term momentum but fading near-term enthusiasm as investors reassess risk in its credit-heavy portfolio.
Scan how other fund managers are handling credit risk and liquidity pressure by reviewing the hand picked list of solid balance sheet and fundamentals (23 results) alongside Apollo Global Management's latest moves.
After a 5 year run that treated Apollo Global Management holders well and a year of pullback and fund stress, the real issue now is whether value creation still lies ahead or if the easy money already passed.
Preferred P/E of 38.9x: Is it justified?
Apollo Global Management trades on a P/E of 38.9x against a recent close of $124.36, which puts a rich valuation on its current earnings given where peers are priced.
The P/E ratio compares the share price to earnings per share and effectively shows how many dollars investors are willing to pay today for each dollar of current profit. For an alternative asset manager with a mix of fee income and performance related earnings that can swing with markets, this metric often reflects how much faith investors have in the resilience of fee streams and in future profit growth.
For Apollo Global Management, the picture is mixed. On one hand, the stock is flagged as trading at a 27.2% discount to an internal fair value estimate, and earnings are forecast to grow about 30.9% a year with high quality earnings. On the other hand, the group reported an earnings decline of about 45.4% over the past year, profit margins compressed from 13.7% to 5.3%, return on equity sits at 10.4%, and the estimated fair P/E of 26.7x sits well below the current 38.9x level, which suggests the market could move toward a lower multiple if those fundamentals do not improve.
Against the US Diversified Financial industry average P/E of 17.1x, Apollo Global Management trades at more than double the sector level. This is a strong signal that investors are paying a premium for its specific business model and profit outlook rather than treating it like a typical peer.
Explore the SWS fair ratio for Apollo Global Management.
Result: Price-to-earnings of 38.9x (OVERVALUED)
Still, a sharp 80.8% fall in annual revenue and stress in credit linked funds could challenge confidence in Apollo Global Management and its premium P/E story.
Find out about the key risks to this Apollo Global Management narrative.
Another View on Apollo Global Management’s Value
The P/E looks stretched for Apollo Global Management, yet the SWS DCF model points the other way. On that approach, APO at $124.36 screens as undervalued against an estimated future cash flow value of $170.81, which raises a simple question. Is the market overpaying for current earnings or underpricing long term cash generation?
For readers who want to see how this cash flow lens is built step by step, there is more detail in the Look into how the SWS DCF model arrives at its fair value.
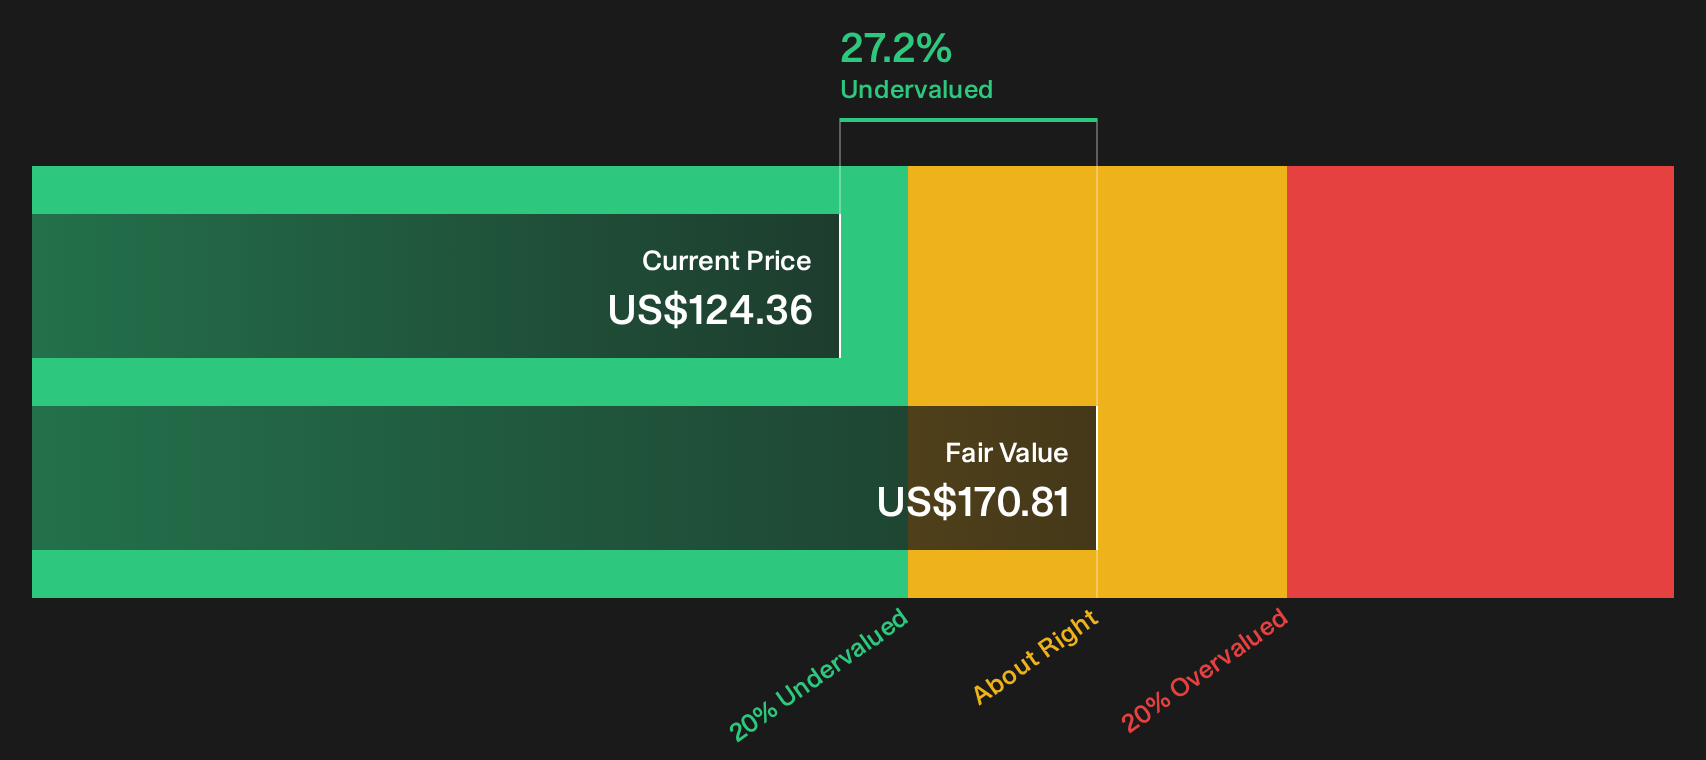
Simply Wall St performs a discounted cash flow (DCF) on every stock in the world every day (check out Apollo Global Management for example). We show the entire calculation in full. You can track the result in your watchlist or portfolio and be alerted when this changes, or use our stock screener to discover 30 high quality undervalued stocks. If you save a screener we even alert you when new companies match - so you never miss a potential opportunity.
Next Steps
Concerned the tone around Apollo Global Management is either too cautious or too upbeat? Act quickly and test that view against the data by weighing the 3 key rewards and 2 important warning signs.
Looking for more Apollo Global Management style investment ideas?
If you want a broader watchlist beyond Apollo Global Management, use the Simply Wall St screener to spot opportunities you might regret missing later.
- Target potential value opportunities before the crowd by scanning the 30 high quality undervalued stocks that combine quality fundamentals with lower implied expectations.
- Strengthen your income stream by reviewing the 7 dividend fortresses that focus on higher yields supported by more robust financial profiles.
- Reduce portfolio stress by filtering for the 31 resilient stocks with low risk scores that score better on balance sheet strength and risk checks.
This article by Simply Wall St is general in nature. We provide commentary based on historical data and analyst forecasts only using an unbiased methodology and our articles are not intended to be financial advice. It does not constitute a recommendation to buy or sell any stock, and does not take account of your objectives, or your financial situation. We aim to bring you long-term focused analysis driven by fundamental data. Note that our analysis may not factor in the latest price-sensitive company announcements or qualitative material. Simply Wall St has no position in any stocks mentioned.
Have feedback on this article? Concerned about the content? Get in touch with us directly. Alternatively, email editorial-team@simplywallst.com