
3 Indian Penny Stocks To Own In September 2026
Rising US Treasury yields are lifting global borrowing costs, which puts pressure on highly indebted businesses and rewards cleaner balance sheets. For Indian penny stocks, that creates a short list of smaller companies where disciplined finances really matter. This article focuses on three such candidates from a financially focused penny stock universe and outlines why their mix of low share prices and relatively solid fundamentals may warrant closer examination at this time.
The stocks covered in the list below are just a starting sample, and the full screen surfaced 118 more financially fit penny stocks with equally compelling stories that are not included here. To identify and analyze those additional ideas directly, head into the Financially Fit Penny Stocks screener.
Swasti Vinayaka Synthetics (BSE:510245)
Overview: Swasti Vinayaka Synthetics manufactures shirting and uniform fabrics for corporate, government and retail buyers, alongside bridal and ethnic apparel.
Operations: The business generates about ₹318 million in revenue from manufacturing shirting fabrics in India, with all reported sales coming domestically.
Market Cap: ₹314 million
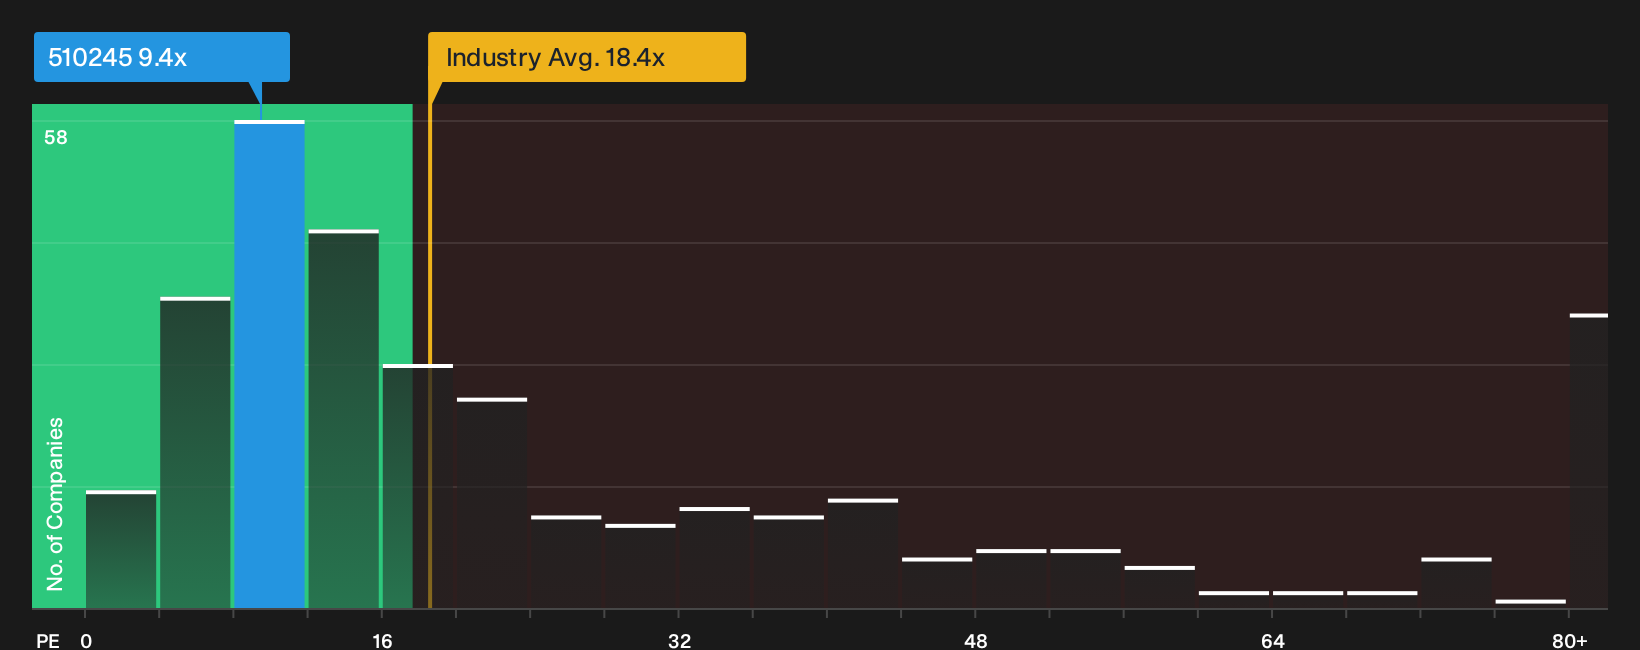
Swasti Vinayaka Synthetics fits the Financially Fit Penny Stocks theme through a uniform and shirting fabric operation that serves corporate and government buyers, supported by a 10.5% net margin and a P/E of 9.4x against higher reported peer multiples. For investors scanning small textile manufacturers with improving earnings, a key consideration is how that margin profile might respond if one significant operating pressure were to change.
If that operating pressure is what you are watching, go deeper with the 2 key rewards and 1 important warning sign to see what might really shift Swasti Vinayaka Synthetics.
Swasti Vinayaka Art and Heritage (BSE:512257)
Overview: Swasti Vinayaka Art and Heritage focuses on low-priced carvings, paintings and jewelry, giving the Financially Fit Penny Stocks theme a direct consumer-art angle.
Market Cap: ₹298 million
Swasti Vinayaka Art and Heritage trades on a penny stock valuation with a P/E of about 6x compared with roughly 18.4x for Indian luxury peers and reports net profit margins of 19.1%. However, Q1 FY2026-27 revenue and net income both declined sharply, so the appeal of a low-priced, profitable art and jewelry player now depends on how pressure on that earnings trend is resolved.
That pressure on earnings is exactly what you need to stress test through the 2 key rewards and 1 important warning sign to see what might be masking or accelerating Swasti Vinayaka Art and Heritage’s story.

Shangar Décor (BSE:540259)
Overview: Shangar Décor runs an event focused decoration and catering business in India, covering weddings, corporate functions, religious gatherings and property lighting.
Operations: Shangar Décor generates about ₹261 million in revenue from its decoration business in India, tied to event focused services.
Market Cap: ₹108 million
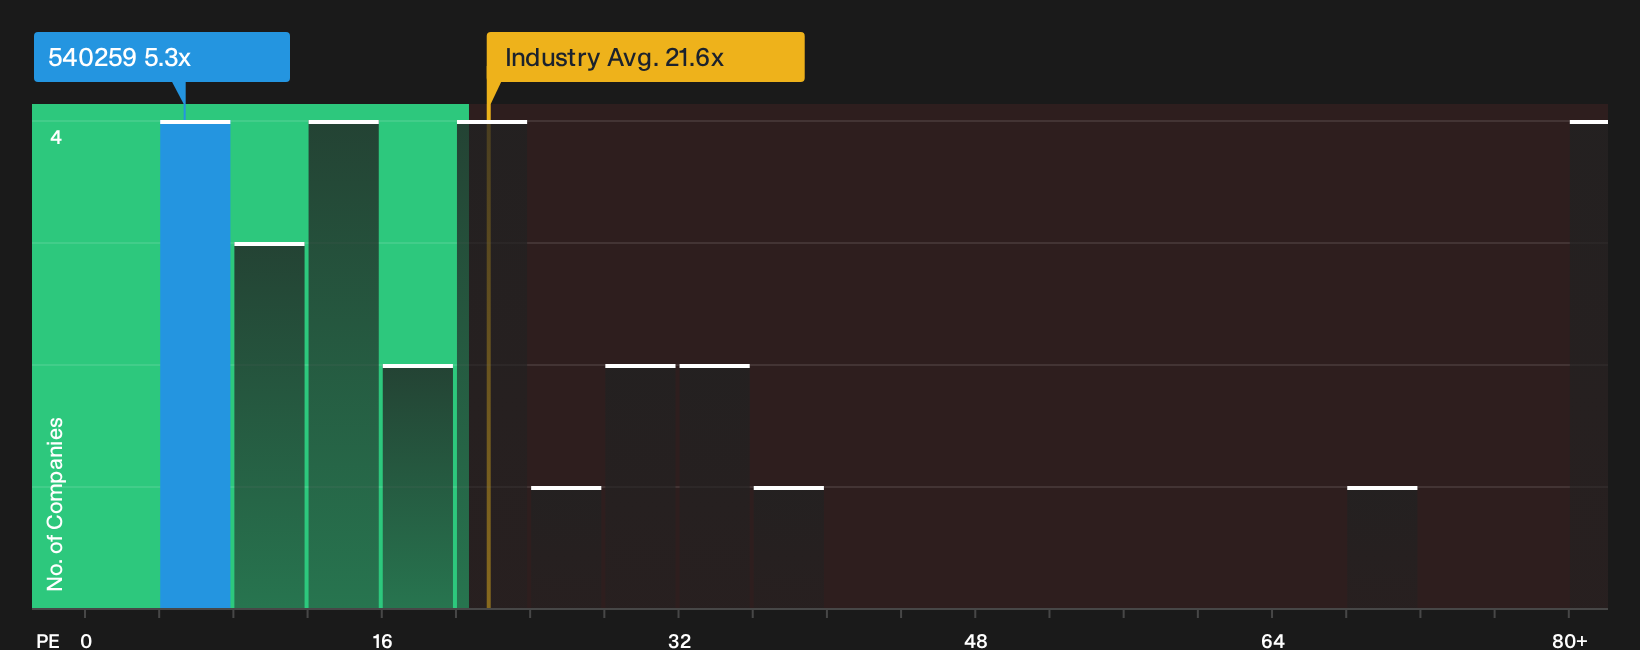
Shangar Décor fits the Financially Fit Penny Stocks theme through its focused event décor and catering activity, combining a small ₹261 million revenue base with 143.7% earnings growth and a 5.3x P/E compared with 21.6x for Indian Consumer Services peers. The appeal of that low multiple on improving margins and higher funding risk now rests on what happens if any single pressure on this model shifts.
If that pressure point on Shangar Décor’s model is what you are tracking, move over to the 2 key rewards and 2 important warning signs to see what could really be accelerating or masking the story.
Seeking Fresh Alternatives Before They Fly
New ideas tend to move first, and prices follow. To catch potential breakout momentum while it is still under the radar and before the data goes stale, consider acting promptly.
- Scan for resilient cash generators with pricing power by running the 173 high quality undervalued stocks while it still reflects businesses the wider market has not fully priced in.
- Track where real earnings power may intersect with AI momentum by reviewing the 38 profitable AI stocks that aren't just burning cash before the strongest operators no longer appear inexpensive on traditional metrics.
- Review potential infrastructure build out opportunities by checking the 39 power grid technology and infrastructure stocks while these balance sheet focused utilities and suppliers remain quietly priced.
This article by Simply Wall St is general in nature. We provide commentary based on historical data and analyst forecasts only using an unbiased methodology and our articles are not intended to be financial advice. It does not constitute a recommendation to buy or sell any stock, and does not take account of your objectives, or your financial situation. We aim to bring you long-term focused analysis driven by fundamental data. Note that our analysis may not factor in the latest price-sensitive company announcements or qualitative material. Simply Wall St has no position in any stocks mentioned.
Have feedback on this article? Concerned about the content? Get in touch with us directly. Alternatively, email editorial-team@simplywallst.com