
International General Insurance Holdings (IGIC) Pulls Back, Is The Stock Still Cheap?
International General Insurance Holdings (IGIC) is back in focus after recent share price weakness, with the stock down over the past month and over the past 3 months, prompting fresh attention on its longer term total returns.
Over the past month the share price has drifted, with a 30 day share price return of down 7.79% and a 90 day move of down 4.86%. Yet International General Insurance Holdings still carries a 1 year total shareholder return of 11.15% and a very large 5 year total shareholder return of 248.01%.
Compare International General Insurance Holdings with a curated set of insurers and specialty finance stocks that also have resilient multi year returns via the 31 resilient stocks with low risk scores
International General Insurance Holdings has produced strong multi year returns and solid recent profit figures, yet the share price has pulled back. Is this still a quality insurer trading on a fair tag today?
Price-to-Earnings of 9.5x: Is it justified?
Valuation on International General Insurance Holdings currently leans on a P/E of 9.5x against a last close of $24.49, which points to the shares pricing in cheaper earnings than many peers and the broader insurance sector.
The P/E ratio compares what investors pay for each dollar of earnings. For an insurer like International General Insurance Holdings, that lens matters because profit quality, underwriting discipline and reserving practices feed directly into those earnings, and the firm is flagged as having high quality past earnings.
IGIC is described as trading at good value overall, with the P/E of 9.5x below both the US Insurance industry average of 10.7x and a peer average of 14.4x. The same P/E also screens as attractive against an estimated fair P/E of 11.6x, which is a level the market could shift toward if sentiment and fundamentals stay aligned.
Explore the SWS fair ratio for International General Insurance Holdings.
Result: Price-to-Earnings of 9.5x (UNDERVALUED)
Still, the recent share price drift and exposure to specialty and reinsurance lines mean any hit to underwriting results or reserve assumptions could quickly challenge this valuation story.
Find out about the key risks to this International General Insurance Holdings narrative.
Another view using cash flows
There is a second lens on International General Insurance Holdings that focuses on cash generation rather than earnings multiples. Our DCF model values IGIC at $38.60 per share, which is above the current $24.49 price and identifies the stock as undervalued on this framework.
DCF work relies heavily on long term assumptions about profits, interest rates and insurance cycles, so any shift in those inputs can move the fair value quickly. The key question for you is whether the quality of IGIC's past earnings and its underwriting mix justify trusting that cash flow path.
Look into how the SWS DCF model arrives at its fair value.
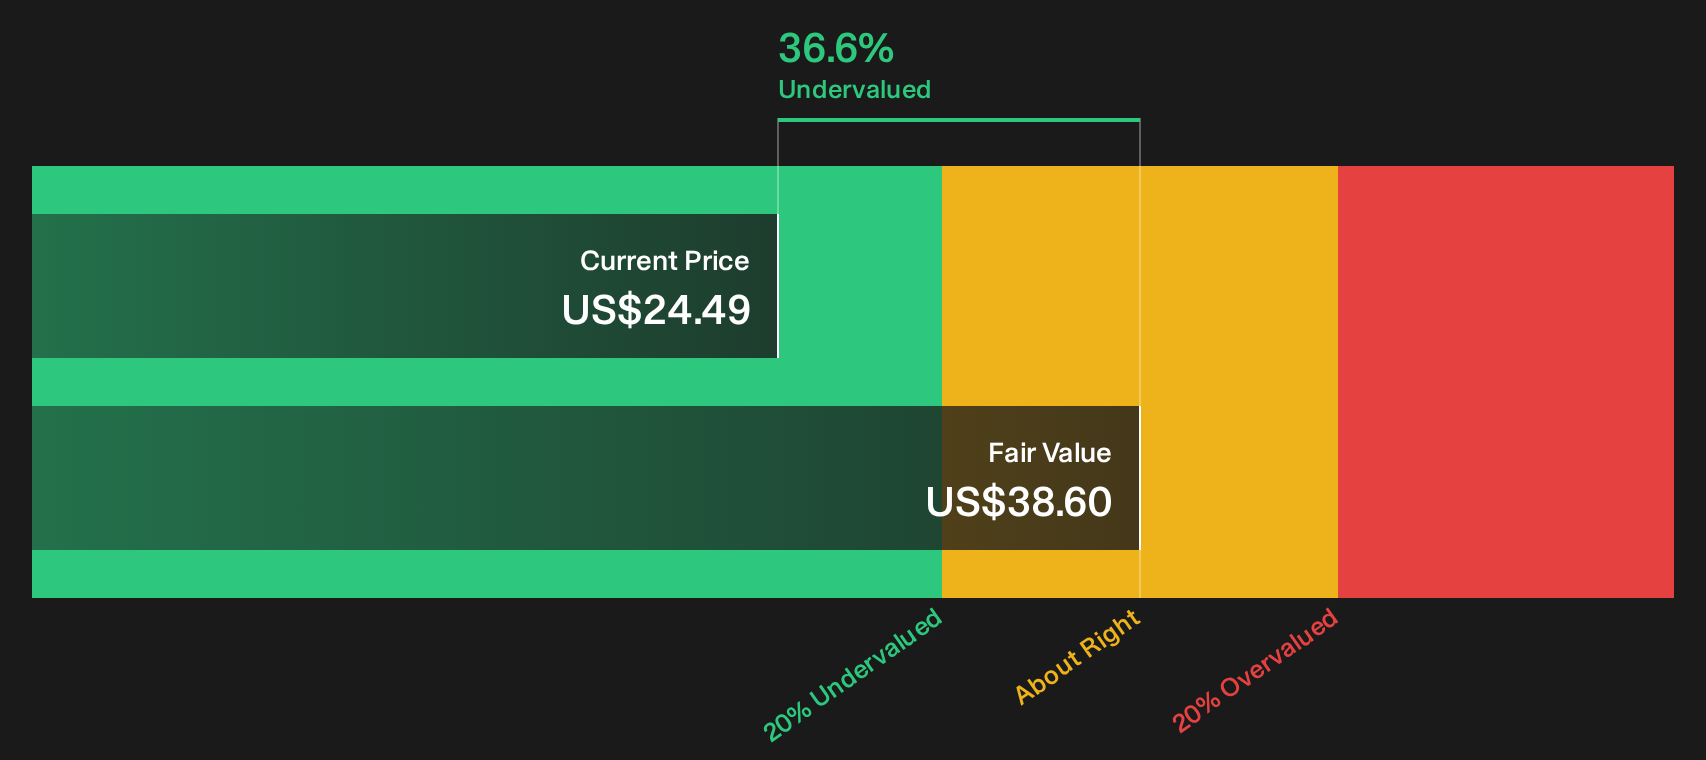
Simply Wall St performs a discounted cash flow (DCF) on every stock in the world every day (check out International General Insurance Holdings for example). We show the entire calculation in full. You can track the result in your watchlist or portfolio and be alerted when this changes, or use our stock screener to discover 30 high quality undervalued stocks. If you save a screener we even alert you when new companies match - so you never miss a potential opportunity.
Next Steps
Mixed message or clear signal? With both risks on the radar and rewards still in play for International General Insurance Holdings, consider reviewing the data promptly and decide where you stand by weighing the 3 key rewards and 1 important warning sign.
Looking for more investment ideas beyond International General Insurance Holdings?
If International General Insurance Holdings has sharpened your focus on quality, do not stop here. Broaden your watchlist with other clear, data backed ideas today.
- Target value opportunities early by using the 30 high quality undervalued stocks that filters for companies where fundamentals and price look out of sync.
- Strengthen your core holdings through the list of solid balance sheet and fundamentals (23 results) that highlight businesses with robust finances and cleaner balance sheets.
- Spot future leaders before the crowd by scanning the 16 high quality undiscovered gems that focuses on high quality companies still flying under most radars.
This article by Simply Wall St is general in nature. We provide commentary based on historical data and analyst forecasts only using an unbiased methodology and our articles are not intended to be financial advice. It does not constitute a recommendation to buy or sell any stock, and does not take account of your objectives, or your financial situation. We aim to bring you long-term focused analysis driven by fundamental data. Note that our analysis may not factor in the latest price-sensitive company announcements or qualitative material. Simply Wall St has no position in any stocks mentioned.
Have feedback on this article? Concerned about the content? Get in touch with us directly. Alternatively, email editorial-team@simplywallst.com