
SJM Holdings (SEHK:880) Leaves FTSE Index On Cheap Valuation Question
SJM Holdings (SEHK:880) was removed from the FTSE All-World Index (USD) on 19 September 2026, a change that can affect passive fund exposure and may prompt investors to reassess the Hong Kong casino operator.
Recent trading shows that SJM Holdings has tried to stabilise, with a 1-day share price return of 1.43% and a 7-day share price return of 1.80%. However, the 30-day and year-to-date share price returns are down 4.71% and 41.53% respectively, and the 1-year total shareholder return has declined 54.35%, pointing to fading momentum even before the index removal sharpened attention on risk perceptions around the stock.
Balance that SJM Holdings setback by scanning a curated 173 high quality undervalued stocks that may offer stronger sentiment support than a stock that was recently removed from a major index.
SJM Holdings now trades after a sharp reset in both index status and recent returns. Does that setback create a compressed entry point, or does it signal that the risk side of the ledger still dominates the reward?
Preferred Price-to-Sales of 0.4x: Is it justified?
SJM Holdings trades on a P/S ratio of 0.4x, which sits well below several reference points that investors often watch, including peers, sector and a fair-value benchmark.
The P/S multiple compares the company’s market value to its annual revenue. For a casino and resort operator where earnings are currently negative, this metric can give you a cleaner read on how the market values each HK$ of turnover, without getting tangled up in short term profit swings.
On that basis, the gap is clear. SJM Holdings changes hands at 0.4x sales, while the Hong Kong Hospitality industry averages 0.9x and the immediate peer group sits around 1.2x. The estimate of a fair P/S ratio is also 0.9x. That is a steep discount across every reference point, and it sets up a scenario where sentiment could eventually migrate closer to that fair level if the recovery and loss reduction story stays on track.
Explore the SWS fair ratio for SJM Holdings.
Result: Price-to-sales of 0.4x (UNDERVALUED)
Still, the SJM Holdings story carries clear risks, including ongoing net losses of HK$541.5m and single market exposure to Macau, which could pressure any recovery narrative.
Find out about the key risks to this SJM Holdings narrative.
Another View on SJM Holdings Valuation
The P/S discount presents SJM Holdings as cheap, yet the SWS DCF model is even more aggressive. At HK$1.42, the share price sits well below an estimated future cash flow value of HK$3.91. This implies a very large gap that could either signal upside or a missing risk factor.
Look into how the SWS DCF model arrives at its fair value.
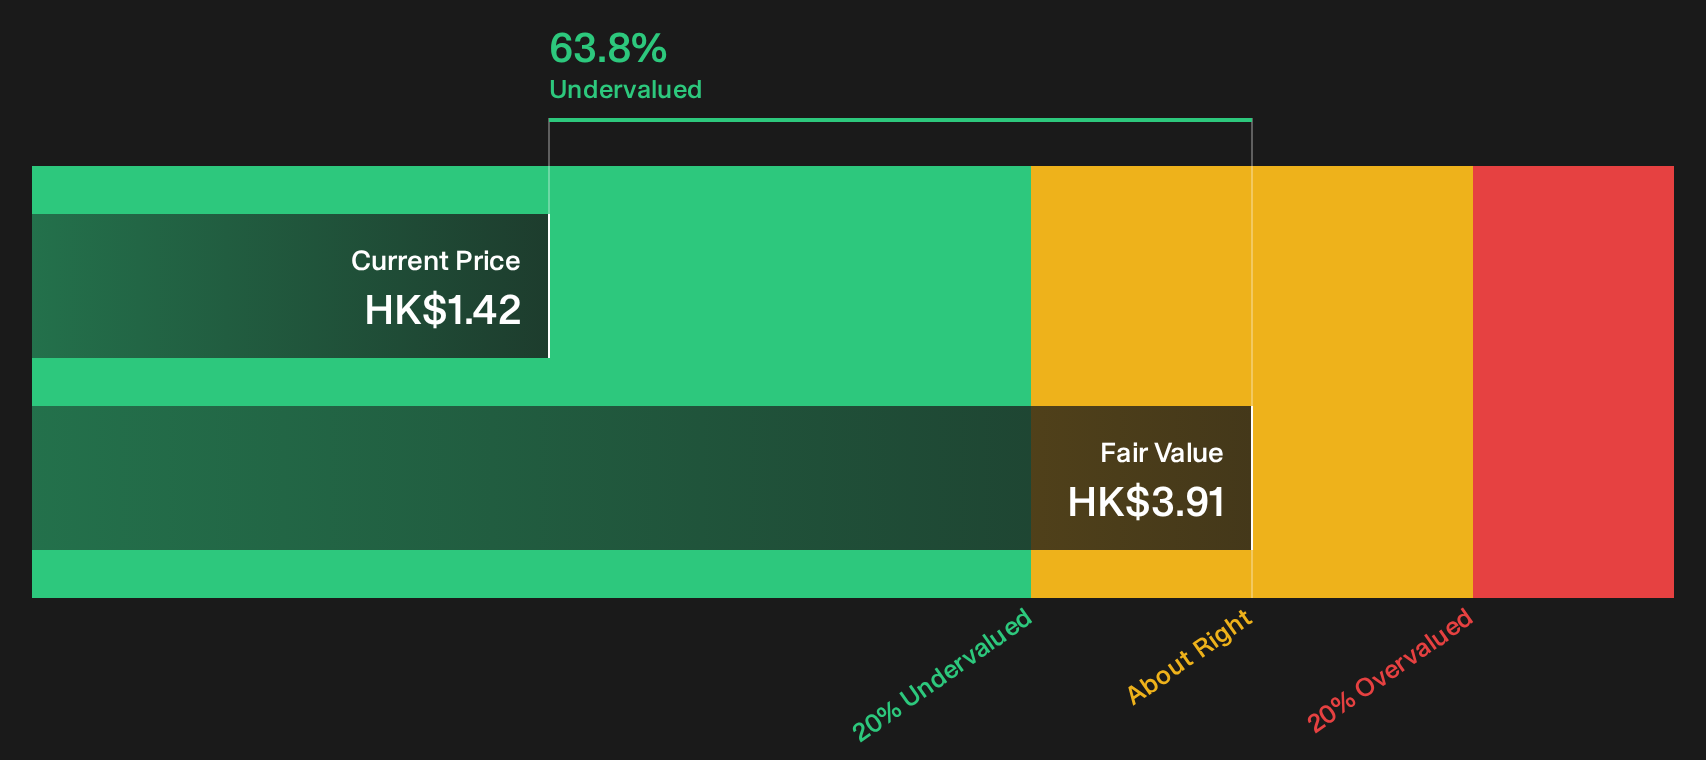
Simply Wall St performs a discounted cash flow (DCF) on every stock in the world every day (check out SJM Holdings for example). We show the entire calculation in full. You can track the result in your watchlist or portfolio and be alerted when this changes, or use our stock screener to discover 173 high quality undervalued stocks. If you save a screener we even alert you when new companies match - so you never miss a potential opportunity.
Next Steps
Unsure whether the market is too pessimistic or not pessimistic enough on SJM Holdings right now? Move quickly, review the same inputs, and pressure test your own thesis with the 3 key rewards.
Looking for more investment ideas beyond SJM Holdings?
Do not stop with SJM Holdings. Broaden your opportunity set now with a few focused stock lists that can help you upgrade the quality of ideas on your radar.
- Target resilience first and stress test your watchlist against a 230 resilient stocks with low risk scores that aims to keep downside surprises firmly in view.
- Hunt for mispricing by scanning a curated 619 high quality undiscovered gems that many investors may not be watching yet.
- Prioritise financial strength by filtering for companies on the list of solid balance sheet and fundamentals (198 results) before you commit fresh capital.
This article by Simply Wall St is general in nature. We provide commentary based on historical data and analyst forecasts only using an unbiased methodology and our articles are not intended to be financial advice. It does not constitute a recommendation to buy or sell any stock, and does not take account of your objectives, or your financial situation. We aim to bring you long-term focused analysis driven by fundamental data. Note that our analysis may not factor in the latest price-sensitive company announcements or qualitative material. Simply Wall St has no position in any stocks mentioned.
Have feedback on this article? Concerned about the content? Get in touch with us directly. Alternatively, email editorial-team@simplywallst.com