
Exploring 3 Undiscovered Gems in Asia with Strong Potential
As the Asian markets navigate a landscape marked by fluctuating energy prices and evolving monetary policies, small-cap stocks are drawing increased attention due to their potential for growth in this dynamic environment. In such conditions, identifying stocks with solid fundamentals and unique market positions can be key to uncovering opportunities that may not yet be widely recognized.
Top 10 Undiscovered Gems With Strong Fundamentals In Asia
| Name | Debt To Equity | Revenue Growth | Earnings Growth | Health Rating |
|---|---|---|---|---|
| Cybozu | 0.16% | 17.06% | 54.02% | ★★★★★★ |
| Ad-Sol Nissin | NA | 7.22% | 15.60% | ★★★★★★ |
| Chongqing Machinery & Electric | 18.92% | 8.43% | 26.16% | ★★★★★★ |
| Yahagi ConstructionLtd | 19.18% | 12.68% | 22.27% | ★★★★★★ |
| Taiyo KagakuLtd | 0.68% | 6.49% | 11.88% | ★★★★★★ |
| SPRIX | 13.12% | 6.95% | -5.71% | ★★★★★★ |
| Forth Smart Service | 44.85% | -3.80% | 10.19% | ★★★★★☆ |
| Sing Investments & Finance | 0.10% | 5.85% | 7.00% | ★★★★☆☆ |
| Shengda ResourcesLtd | 57.58% | 8.61% | 9.90% | ★★★☆☆☆ |
| Primo Global Holdings | 70.93% | 9.87% | 28.79% | ★★★☆☆☆ |
We're going to check out a few of the best picks from our screener tool.
Kona ILtd (KOSDAQ:A052400)
Simply Wall St Value Rating: ★★★★★★
Overview: Kona I Co., Ltd. offers solutions and platforms for the financial technology market both in South Korea and internationally, with a market cap of ₩525.99 billion.
Operations: Kona I Ltd. generates revenue through its financial technology solutions and platforms, serving both domestic and international markets. The company has a market cap of ₩525.99 billion, reflecting its position in the industry.
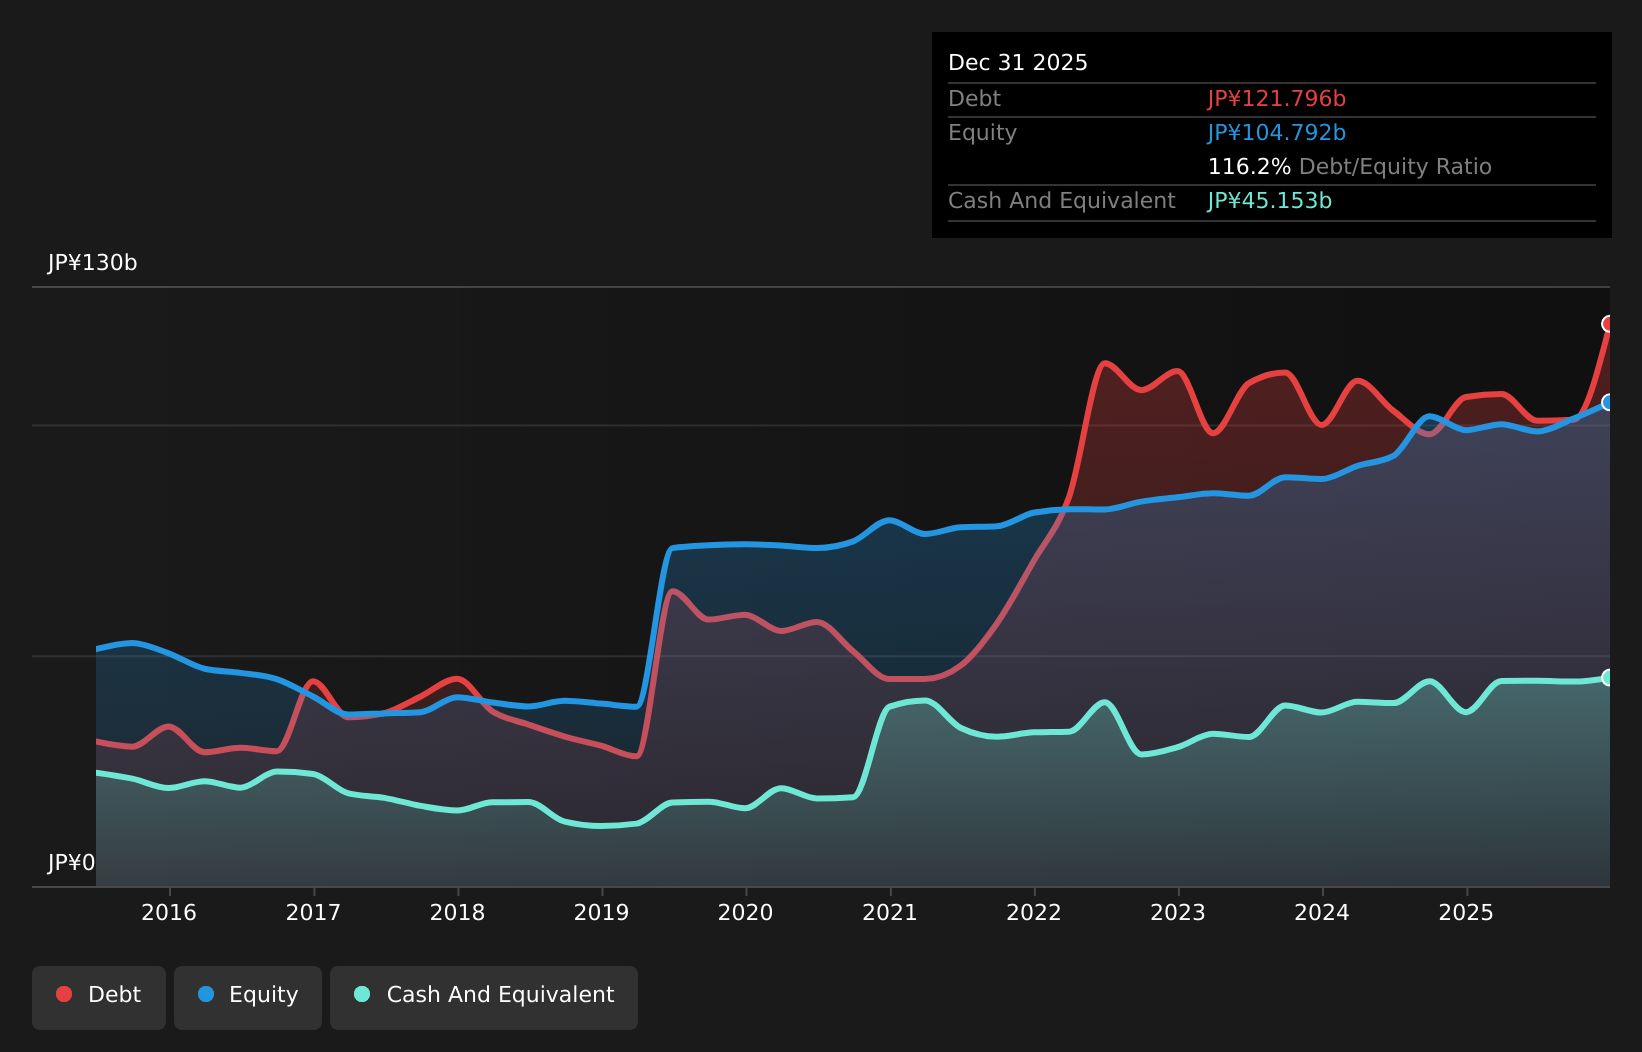
Kona I Ltd. has been making waves with a robust earnings growth of 146.6% over the past year, far outpacing the tech industry average of 43.5%. Trading at a substantial discount, nearly 96.7% below its estimated fair value, Kona I appears to offer good relative value compared to peers and industry standards. The company has also made strides in reducing its debt-to-equity ratio from 25.9% to 13.5% over five years, showcasing prudent financial management. Recent announcements reveal significant share repurchases totaling KRW 5 billion for stability and shareholder value enhancement, alongside impressive sales figures doubling year-over-year to KRW 18 billion for the first half of this year.
- Click to explore a detailed breakdown of our findings in Kona ILtd's health report.
Gain insights into Kona ILtd's past trends and performance with our Past report.
Shanghai Allist Pharmaceuticals (SHSE:688578)
Simply Wall St Value Rating: ★★★★★★
Overview: Shanghai Allist Pharmaceuticals Co., Ltd. is a pharmaceutical company focused on the research and development of tumor-targeted drugs in China and internationally, with a market cap of CN¥50.59 billion.
Operations: The primary revenue stream for Allist Pharmaceuticals is derived from its research and development of drugs, amounting to CN¥6.13 billion.
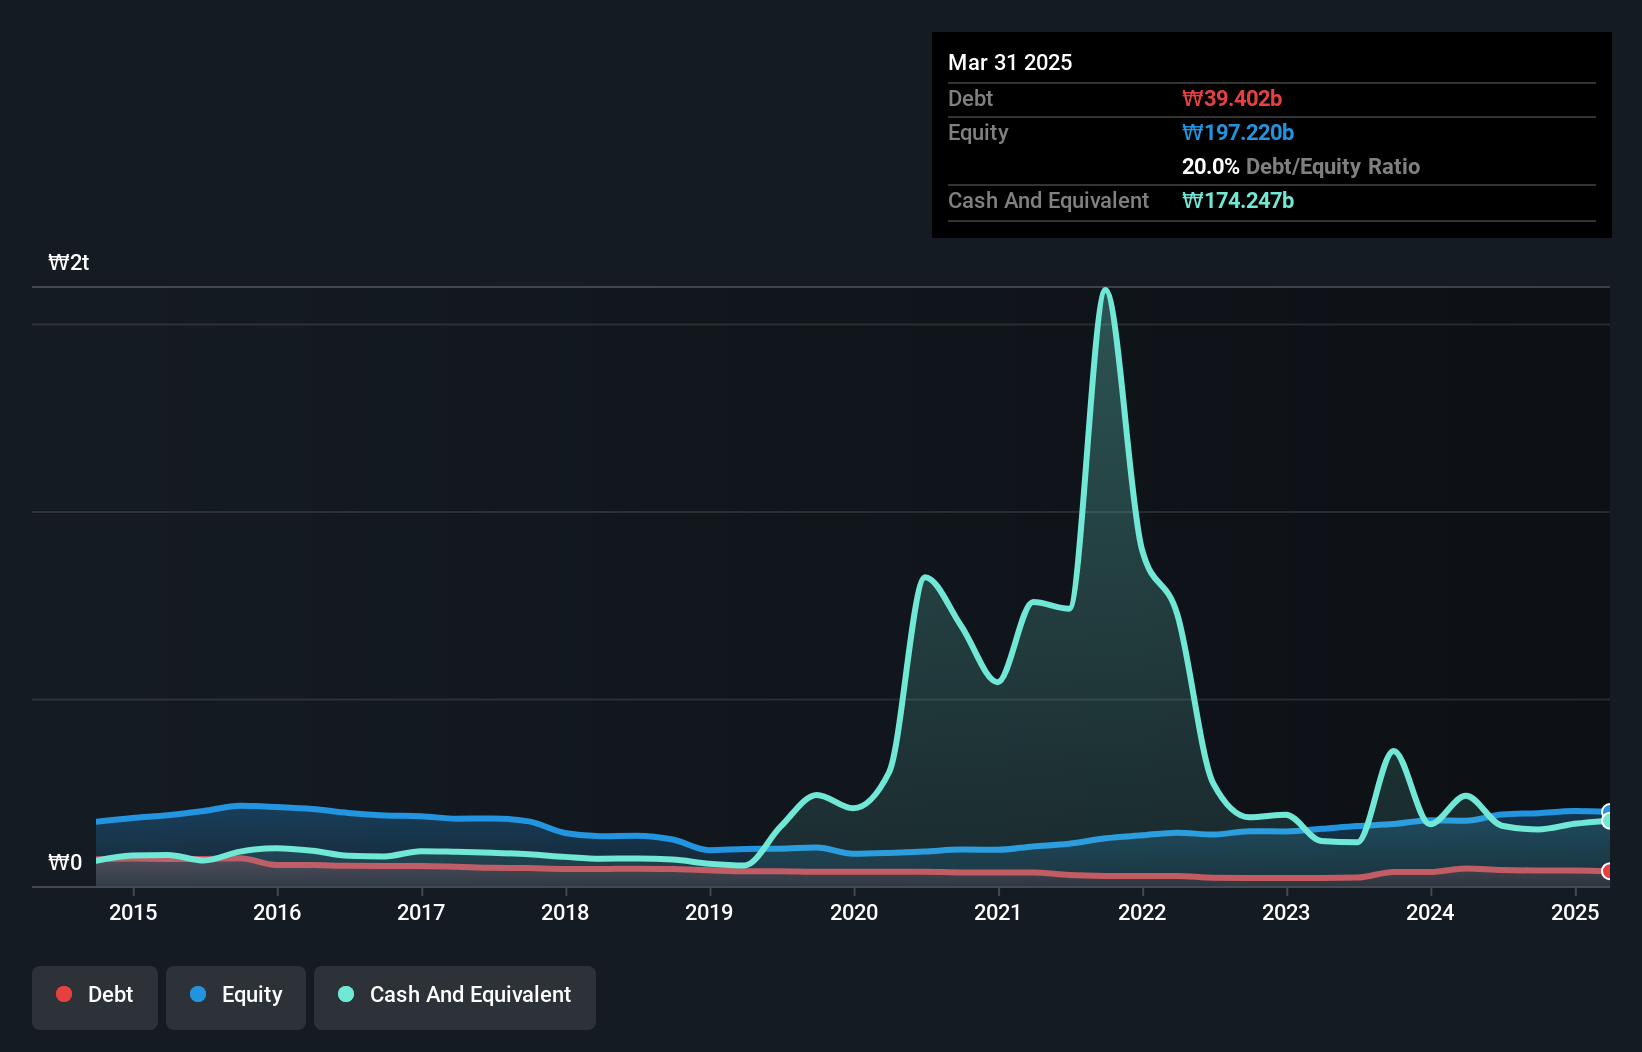
Shanghai Allist Pharmaceuticals, a nimble player in the pharmaceutical sector, has shown impressive financial health with earnings growing by 46.8% over the past year, outpacing the industry average of -3%. The company is debt-free and trades at 52.2% below its estimated fair value, suggesting potential upside. Recent figures reveal a revenue increase to CNY 3.32 billion from CNY 2.37 billion last year and net income rising to CNY 1.54 billion from CNY 1.05 billion previously, indicating robust growth momentum. With high-quality earnings and positive free cash flow, it seems poised for continued advancement in its market niche.
Restar (TSE:3156)
Simply Wall St Value Rating: ★★★☆☆☆
Overview: Restar Corporation operates in the sale of semiconductors, electronic components, image sensors, cameras, and related products across several countries including Japan and China, with a market cap of ¥165.61 billion.
Operations: Restar Corporation's revenue is primarily driven by its Device BU - Device segment, generating ¥588.80 billion, followed by the Device BU - EMS at ¥22.05 billion. The System Business Unit contributes through Eco Solution and System Solutions segments, with revenues of ¥16.92 billion and ¥35.65 billion respectively, while Industrial, Transmission and Systems Equipment adds another ¥25.51 billion.
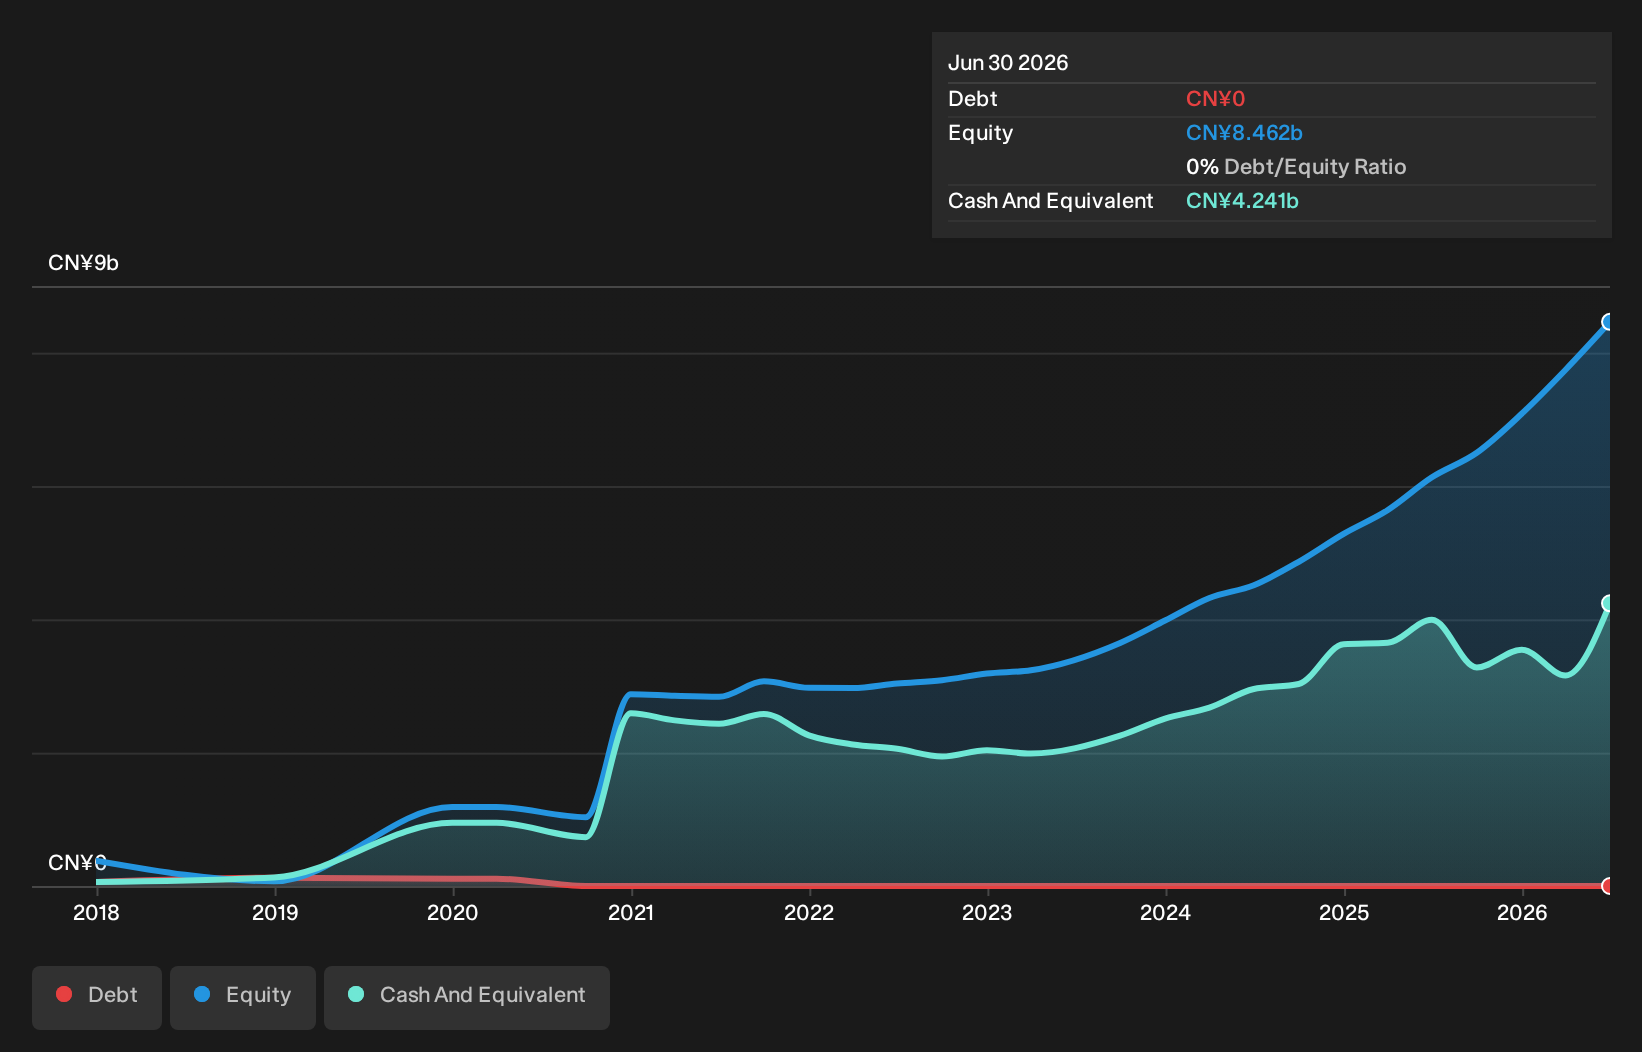
Restar, a notable player in the electronics sector, is trading at 43.2% below its estimated fair value, suggesting potential undervaluation. The company has seen impressive earnings growth of 165.7% over the past year, far outpacing the electronic industry's average of 25.7%. However, its net debt to equity ratio stands at a high 84.8%, having risen from 61.5% over five years, indicating increased leverage concerns despite well-covered interest payments by EBIT at an impressive 8.9x coverage ratio. Recent strategic moves include a joint venture with Rashi Peripherals Limited to enhance semiconductor solutions for industrial and automotive applications in India, highlighting Restar's commitment to expanding its technological footprint and market reach within Asia's growing sectors.
- Get an in-depth perspective on Restar's performance by reading our health report here.
Assess Restar's past performance with our detailed historical performance reports.
Where To Now?
- Access the full spectrum of 115 Asian Undiscovered Gems With Strong Fundamentals by clicking on this link.
- Are you invested in these stocks already? Keep abreast of every twist and turn by setting up a portfolio with Simply Wall St, where we make it simple for investors like you to stay informed and proactive.
- Simply Wall St is a revolutionary app designed for long-term stock investors, it's free and covers every market in the world.
Contemplating Other Strategies?
- Explore high-performing small cap companies that haven't yet garnered significant analyst attention.
- Fuel your portfolio with companies showing strong growth potential, backed by optimistic outlooks both from analysts and management.
- Find companies with promising cash flow potential yet trading below their fair value.
This article by Simply Wall St is general in nature. We provide commentary based on historical data and analyst forecasts only using an unbiased methodology and our articles are not intended to be financial advice. It does not constitute a recommendation to buy or sell any stock, and does not take account of your objectives, or your financial situation. We aim to bring you long-term focused analysis driven by fundamental data. Note that our analysis may not factor in the latest price-sensitive company announcements or qualitative material. Simply Wall St has no position in any stocks mentioned.
Have feedback on this article? Concerned about the content? Get in touch with us directly. Alternatively, email editorial-team@simplywallst.com