
CACI International (CACI), What Is Behind The Fresh Attention?
CACI International (CACI) just booked two major wins: a multi year contract supporting U.S. Central Command and a role supplying optical imaging payloads for Vantor’s planned Pulse satellite constellation.
These wins arrive after a sharp run in CACI International’s share price over the past quarter, with a 90 day share price return of 39.12%. This builds on a 24.02% one year total shareholder return, even as the 30 day share price return of 3.11% shows momentum pausing at the recent US$616.68 level.
Scan for other contractors showing similar contract momentum to CACI International by running the hand picked list of solid balance sheet and fundamentals (23 results) alongside this latest USCENTCOM and Vantor news flow.
CACI International now trades well below both intrinsic value estimates and published analyst targets after that sharp move. Is the market prudently fading contract excitement, or mispricing a stronger long term earnings profile?
Most Popular CACI International Narrative: 16.1% Undervalued
The most followed narrative on CACI International values the shares at $735.21, above the recent $616.68 close, and ties that gap directly to backlog quality and margin potential.
The main thing that has to go right is that CACI International converts its growing electronic warfare, counter UAS, and space program wins, along with expanded nontraditional procurement channels, into sustainably higher margins and free cash flow despite concerns about free cash flow margin and returns on capital.
The numbers imply that CACI International’s share price embeds a discount to a business generating at least US$900m of free cash flow in FY27 and at least US$2.1b over FY25 to FY27 with EBITDA margins in the high 12% range, which this narrative views as consistent with an undervalued and bullish setup.
See why 26 investors see CACI International as 16% undervalued.
Result: Fair Value of $735.21 (UNDERVALUED)
Still, the CACI International narrative can crack if the record US$32b backlog fails to convert as expected, or if free cash flow margins stay under pressure.
Find out about the key risks to this CACI International narrative.
Another View: CACI International Through The P/E Lens
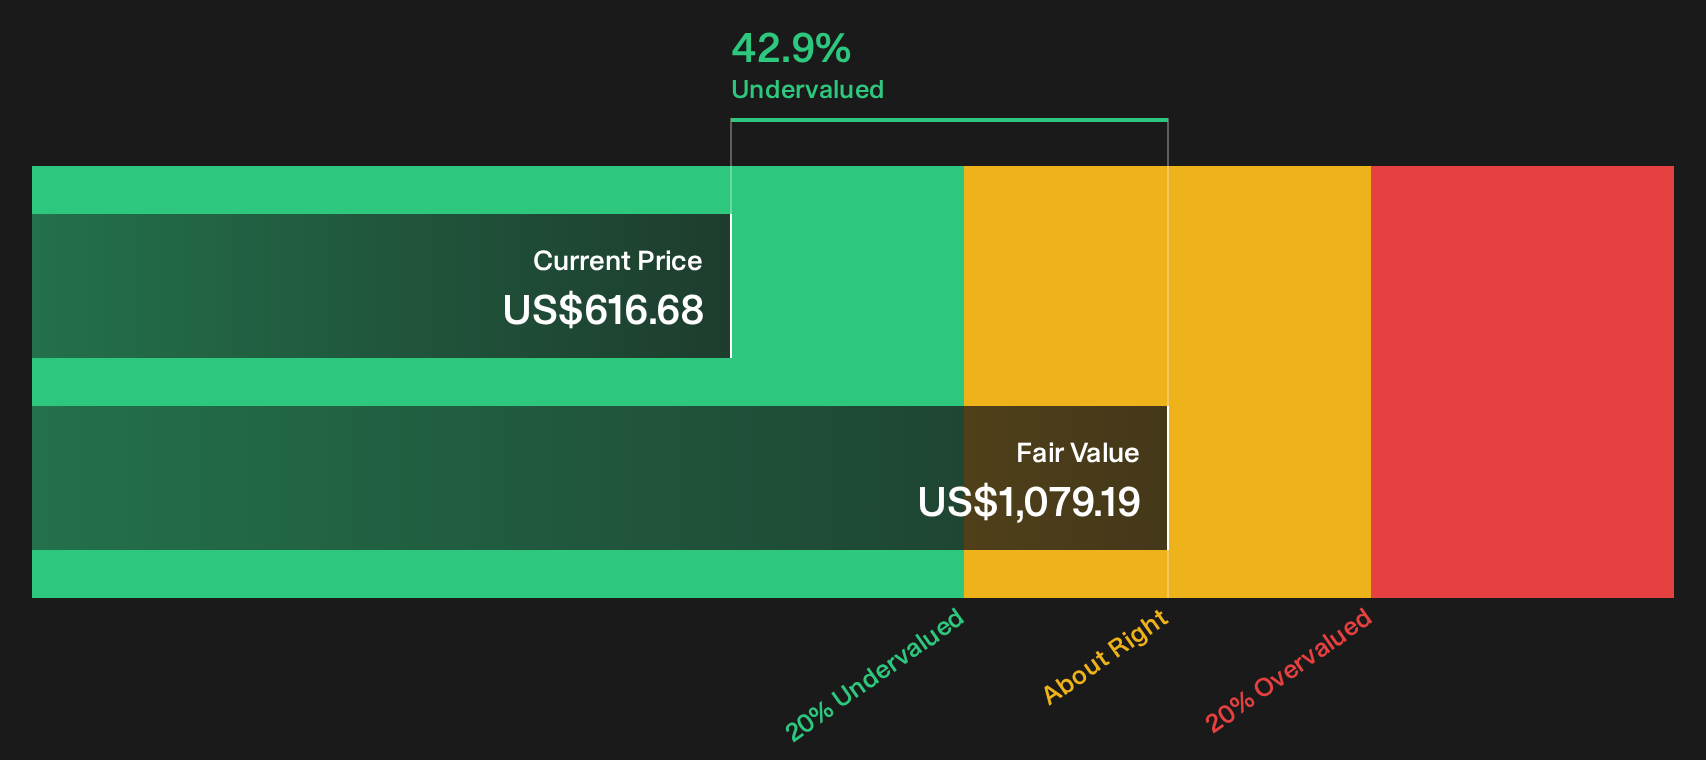
The discounted cash flow view presents CACI International as attractively priced, with the shares trading 42.9% below an estimated future cash flow value of $1,079.19. A simple P/E check tells a different story. At 25.4x earnings, CACI trades richer than the US Professional Services sector on 21.4x and above its own fair ratio of 22.7x, which suggests less margin for error if growth or margins fall short. Which signal do you rely on more when the narratives disagree?
For investors who want to see exactly how this cash flow based estimate was built, the SWS DCF model breaks out every step in the calculation in plain numbers. Look into how the SWS DCF model arrives at its fair value.
Next Steps
Mixed signals on CACI International so far. If you want to move quickly and set your own stance, start by weighing the 3 key rewards and 1 important warning sign.
Looking for more CACI International style investment ideas?
If you like what the recent CACI International moves reveal about contract momentum and pricing, do not stop here. Broader opportunity often sits just one screen away.
- Target resilient businesses first and run the 31 resilient stocks with low risk scores so potential drawdowns do not blindside your long term plan.
- Hunt for quality at a discount and let the 16 high quality undiscovered gems surface companies with fundamentals that the wider market has not fully focused on yet.
- Build a core that can weather more cycles and use the 7 dividend fortresses to find income ideas that might steady your portfolio.
This article by Simply Wall St is general in nature. We provide commentary based on historical data and analyst forecasts only using an unbiased methodology and our articles are not intended to be financial advice. It does not constitute a recommendation to buy or sell any stock, and does not take account of your objectives, or your financial situation. We aim to bring you long-term focused analysis driven by fundamental data. Note that our analysis may not factor in the latest price-sensitive company announcements or qualitative material. Simply Wall St has no position in any stocks mentioned.
Have feedback on this article? Concerned about the content? Get in touch with us directly. Alternatively, email editorial-team@simplywallst.com