
Mars Group Holdings Corporation (TSE:6419) Looks Like A Good Stock, And It's Going Ex-Dividend Soon
It looks like Mars Group Holdings Corporation (TSE:6419) is about to go ex-dividend in the next 3 days. The ex-dividend date is commonly two business days before the record date, which is the cut-off date for shareholders to be present on the company's books to be eligible for a dividend payment. The ex-dividend date is important as the process of settlement involves at least two full business days. So if you miss that date, you would not show up on the company's books on the record date. Meaning, you will need to purchase Mars Group Holdings' shares before the 29th of September to receive the dividend, which will be paid on the 10th of December.
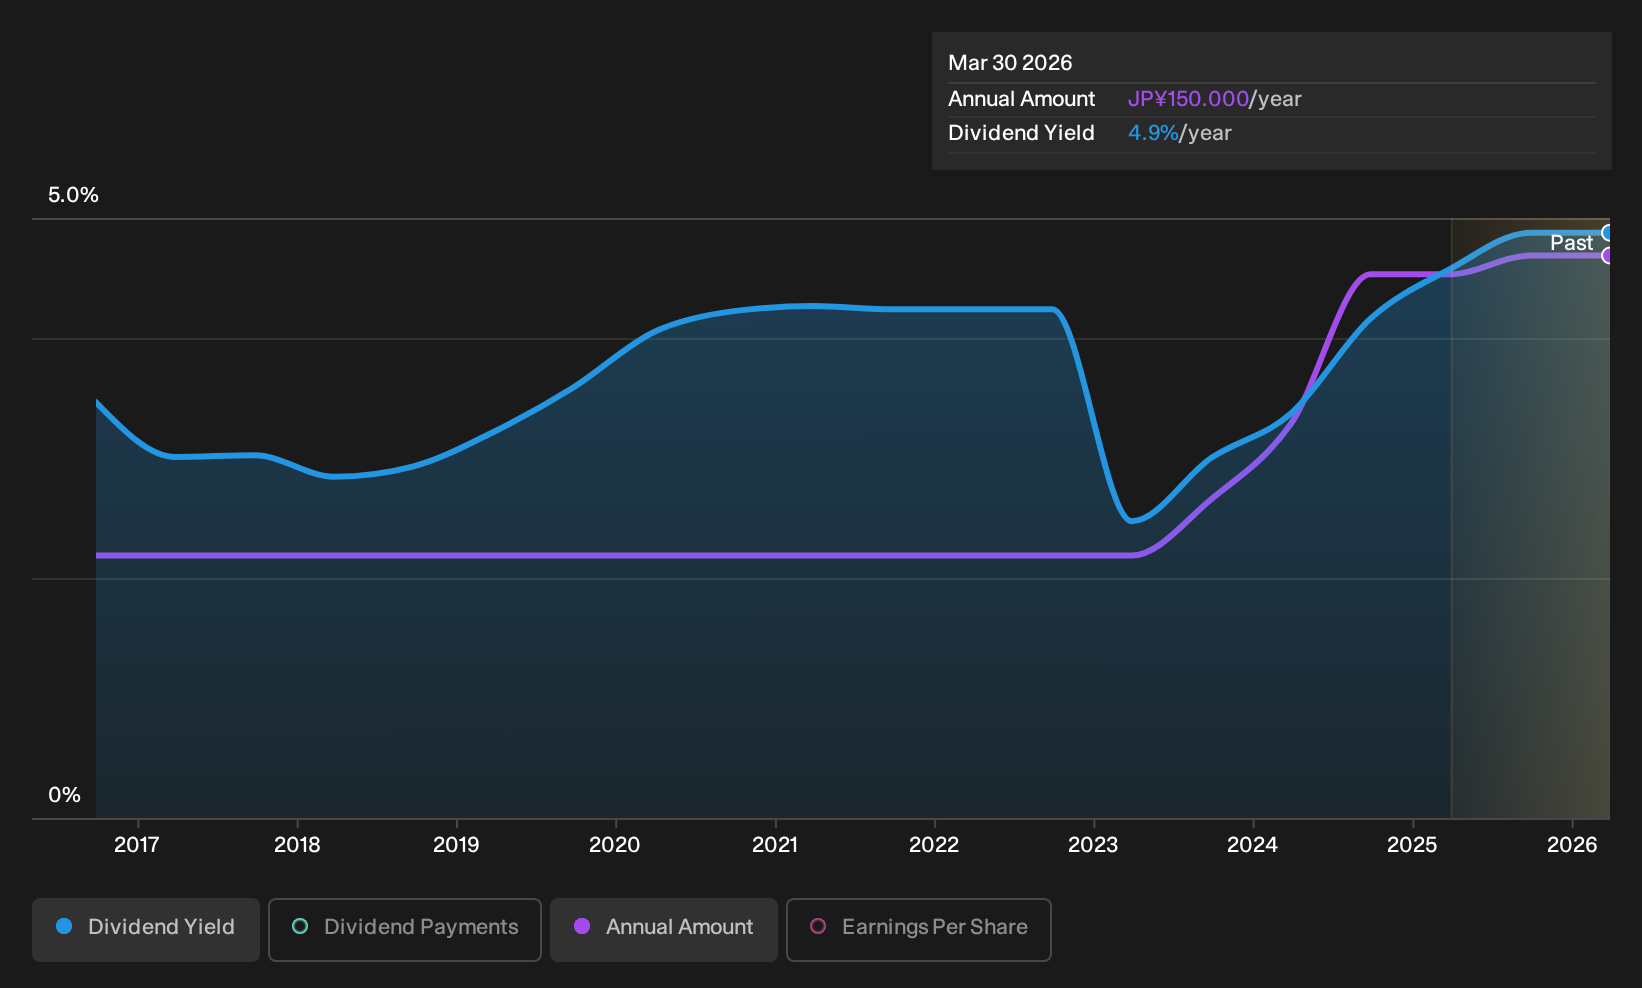
The company's next dividend payment will be JP¥75.00 per share, on the back of last year when the company paid a total of JP¥150 to shareholders. Last year's total dividend payments show that Mars Group Holdings has a trailing yield of 4.7% on the current share price of JP¥3165.00. We love seeing companies pay a dividend, but it's also important to be sure that laying the golden eggs isn't going to kill our golden goose! We need to see whether the dividend is covered by earnings and if it's growing.
Dividends are typically paid from company earnings. If a company pays more in dividends than it earned in profit, then the dividend could be unsustainable. Mars Group Holdings paid out a comfortable 46% of its profit last year. Yet cash flow is typically more important than profit for assessing dividend sustainability, so we should always check if the company generated enough cash to afford its dividend. Thankfully its dividend payments took up just 47% of the free cash flow it generated, which is a comfortable payout ratio.
It's encouraging to see that the dividend is covered by both profit and cash flow. This generally suggests the dividend is sustainable, as long as earnings don't drop precipitously.
See our latest analysis for Mars Group Holdings
Click here to see how much of its profit Mars Group Holdings paid out over the last 12 months.
Have Earnings And Dividends Been Growing?
Companies with consistently growing earnings per share generally make the best dividend stocks, as they usually find it easier to grow dividends per share. If earnings fall far enough, the company could be forced to cut its dividend. That's why it's comforting to see Mars Group Holdings's earnings have been skyrocketing, up 47% per annum for the past five years. Earnings per share have been growing very quickly, and the company is paying out a relatively low percentage of its profit and cash flow. Companies with growing earnings and low payout ratios are often the best long-term dividend stocks, as the company can both grow its earnings and increase the percentage of earnings that it pays out, essentially multiplying the dividend.
Many investors will assess a company's dividend performance by evaluating how much the dividend payments have changed over time. In the past 10 years, Mars Group Holdings has increased its dividend at approximately 9.6% a year on average. We're glad to see dividends rising alongside earnings over a number of years, which may be a sign the company intends to share the growth with shareholders.
To Sum It Up
Has Mars Group Holdings got what it takes to maintain its dividend payments? We love that Mars Group Holdings is growing earnings per share while simultaneously paying out a low percentage of both its earnings and cash flow. These characteristics suggest the company is reinvesting in growing its business, while the conservative payout ratio also implies a reduced risk of the dividend being cut in the future. Mars Group Holdings looks solid on this analysis overall, and we'd definitely consider investigating it more closely.
Want to learn more about Mars Group Holdings? Here's a visualisation of its historical rate of revenue and earnings growth.
Generally, we wouldn't recommend just buying the first dividend stock you see. Here's a curated list of interesting stocks that are strong dividend payers.
Have feedback on this article? Concerned about the content? Get in touch with us directly. Alternatively, email editorial-team (at) simplywallst.com.
This article by Simply Wall St is general in nature. We provide commentary based on historical data and analyst forecasts only using an unbiased methodology and our articles are not intended to be financial advice. It does not constitute a recommendation to buy or sell any stock, and does not take account of your objectives, or your financial situation. We aim to bring you long-term focused analysis driven by fundamental data. Note that our analysis may not factor in the latest price-sensitive company announcements or qualitative material. Simply Wall St has no position in any stocks mentioned.