
3 Indian Penny Stocks To Own In September 2026
Bond yields in the US have surged to their highest levels in two decades, lifting the global cost of capital and putting pressure on highly priced stocks. For Indian investors, that spotlight shifts to smaller, lower priced shares where balance sheet strength matters far more than hype. This article walks through three financially solid penny stocks, all trading under 5, that screen for relatively healthier fundamentals in a higher rate environment.
The three penny stocks covered below are only a small sample, with the full screen surfacing 118 more financially fit, low priced companies with balance sheets and cash profiles that also lean toward resilience rather than speculation. To see that broader field and zero in on ideas that match your risk tolerance, head straight into the Financially Fit Penny Stocks screener.
Swasti Vinayaka Synthetics (BSE:510245)
Overview: Swasti Vinayaka Synthetics manufactures shirting and suiting fabrics in India, with a focus on uniform textiles and apparel garments.
Operations: Swasti Vinayaka Synthetics generated about ₹318 million from manufacturing shirting fabrics in India, reflecting a single segment textile operation.
Market Cap: ₹324.9 million
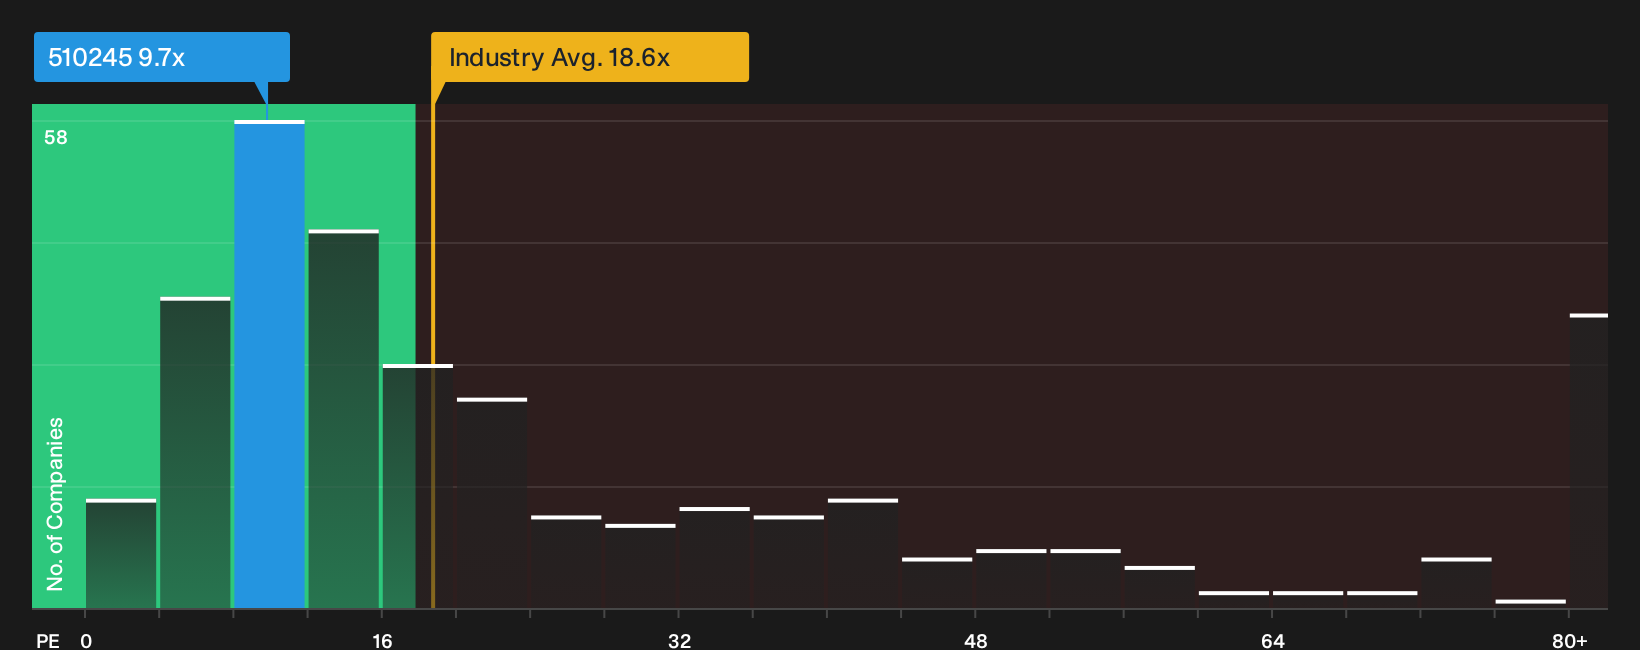
Swasti Vinayaka Synthetics ties neatly into the Financially Fit Penny Stocks theme, with a real fabric business, rising earnings and a low P/E multiple for a small textile producer. The tiny revenue base and reliance on external borrowing mean financial health still rests on how one unseen pressure on its fabric demand and margins plays out.
If that unseen pressure has you curious about how resilient Swasti Vinayaka Synthetics really is, the 2 key rewards and 1 important warning sign could clarify what the market is missing.
Swasti Vinayaka Art and Heritage (BSE:512257)
Overview: Swasti Vinayaka Art and Heritage manufactures and sells carvings of precious and semi-precious stones, paintings, and jewelry in India, aligning its core activity with the Financially Fit Penny Stocks theme.
Market Cap: ₹289.8 million
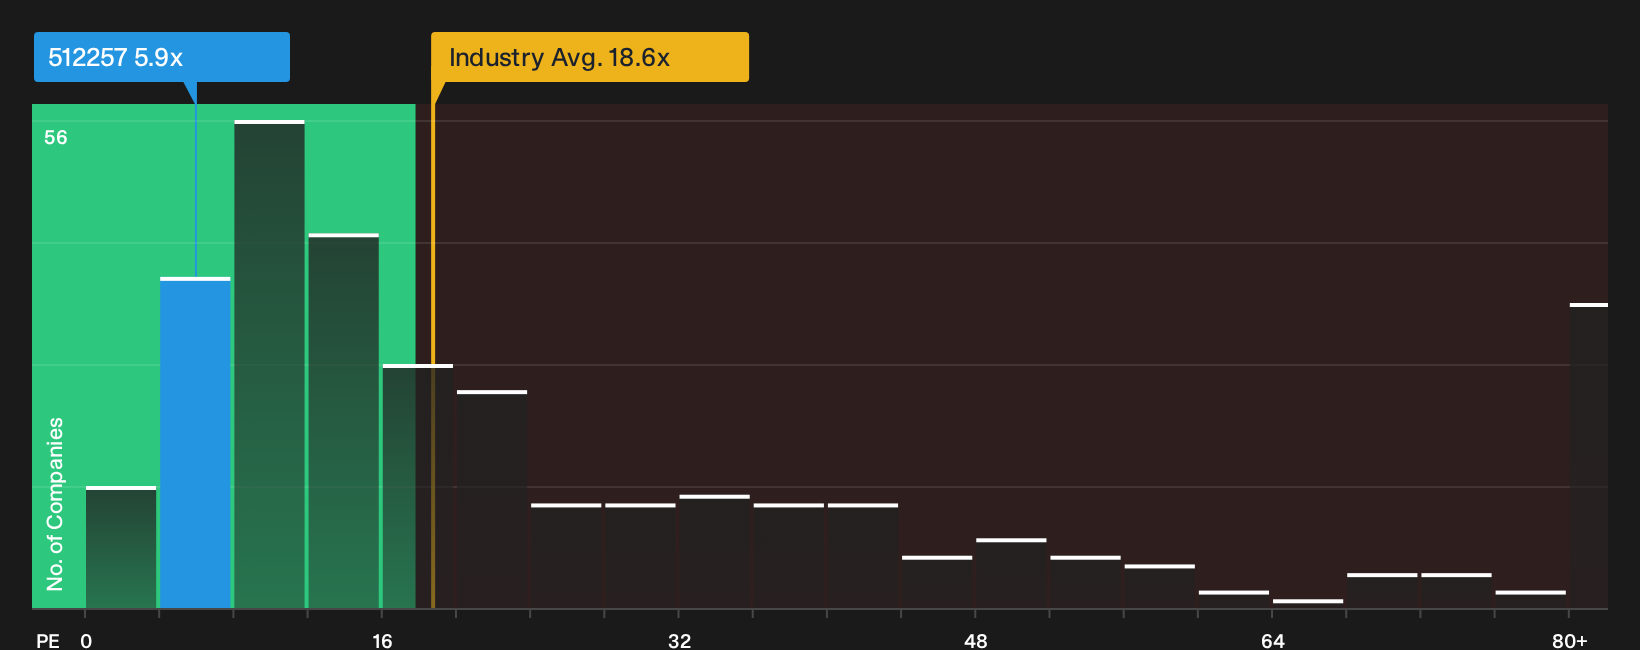
Swasti Vinayaka Art and Heritage fits this financially focused penny stock screen as a small Mumbai based art and jewelry producer with a 5.9x P/E, 19.1% net margin, and 16.1% average annual earnings growth over five years. However, the tiny ₹258 million revenue base means its resilience is closely linked to potential pressures on demand for its niche products.
Those pressures on niche demand make it worth scanning the 2 key rewards and 1 important warning sign to see where Swasti Vinayaka Art and Heritage could be mispriced on quality and risk.
Shangar Décor (BSE:540259)
Overview: Shangar Décor runs event decoration and catering services in India, focusing on weddings, corporate functions and religious gatherings.
Operations: Shangar Décor generates about ₹261 million from its decoration business in India, reflecting a single segment, contract driven operation.
Market Cap: ₹107.7 million
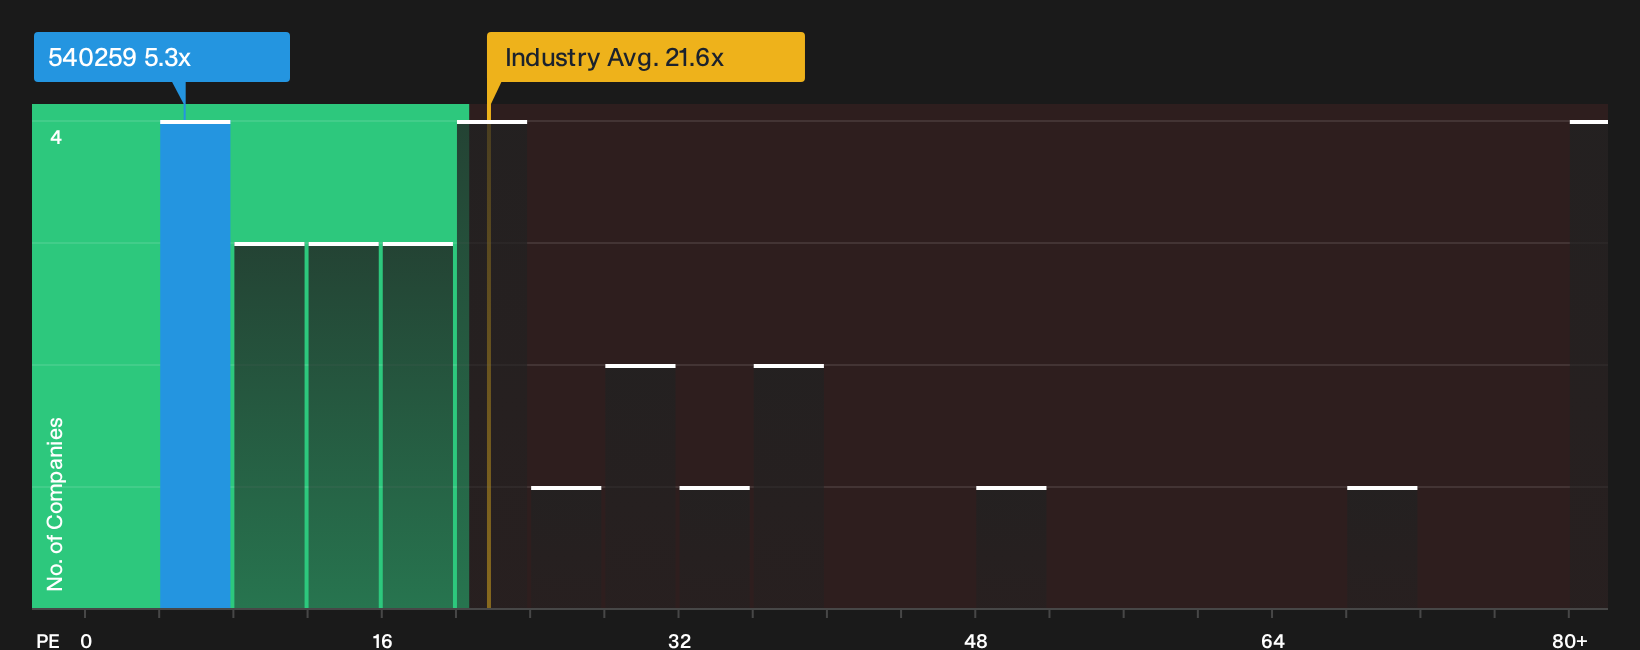
Shangar Décor fits the Financially Fit Penny Stocks theme as a low priced contractor with ₹261 million in event decoration revenue and 7.8% profit margins, trading on a low P/E while earnings and margins trend higher. The appeal sits beside one unresolved issue that could significantly influence how sustainable those contract driven profits really are.
That unresolved issue makes it worth checking the 2 key rewards and 2 important warning signs to see whether Shangar Décor’s contract profits are quietly compounding strength or masking fragility.
Seeking Alternatives Before The Crowd?
Fresh ideas move first. Breakout trends, rising momentum and quietly flying opportunities often get caught late once attention floods in. Scan under the radar for now and act before the crowd.
- Spot resilient cash generators early by reviewing the list of solid balance sheet and fundamentals (200 results), before stronger balance sheets stop trading at quiet valuations.
- Ride structural power demand momentum by checking the 39 power grid technology and infrastructure stocks that tracks grid technology players before attention floods the sector.
- Track the next wave of automation by using the 93 robotics and automation stocks where carefully filtered operators could gain traction while they are still underfollowed.
This article by Simply Wall St is general in nature. We provide commentary based on historical data and analyst forecasts only using an unbiased methodology and our articles are not intended to be financial advice. It does not constitute a recommendation to buy or sell any stock, and does not take account of your objectives, or your financial situation. We aim to bring you long-term focused analysis driven by fundamental data. Note that our analysis may not factor in the latest price-sensitive company announcements or qualitative material. Simply Wall St has no position in any stocks mentioned.
Have feedback on this article? Concerned about the content? Get in touch with us directly. Alternatively, email editorial-team@simplywallst.com