
Eli Lilly (LLY) Shares Just Moved, So What Is Driving Attention Now?
Eli Lilly (LLY) just secured U.S. FDA approval for Onswik, a once weekly basal insulin for adults with type 2 diabetes, an update that quickly drew investor attention.
The Eli Lilly share price moved higher on the Onswik news, adding to a 1-day share price return of 2.68% and a 7-day share price return of 2.56%, even though the 30-day share price return is down 4.20%. Those short term swings sit against a much stronger backdrop, with a 1-year total shareholder return of 66.44% and a 5-year total shareholder return of about 4.4x. This suggests investors have been rewarding the broader diabetes, obesity and oncology pipeline while reassessing risk and opportunity around each new product approval, plant expansion and research partnership.
Scan other diabetes and obesity players that may be building similar momentum by reviewing the hand-picked 38 healthcare AI stocks aligned with Eli Lilly’s push into AI-enabled drug discovery and cardiometabolic care.
For Eli Lilly, that sharp Onswik bump either mirrors confidence in a cardiometabolic engine still throwing off growth, or it simply stretches already rich expectations. Which story do today’s valuation markers really tell?
Most Popular Narrative: 20% Undervalued
Against a last close of $1,181.89, the most followed narrative on Eli Lilly pegs fair value at $1,477.03, which points to a sizeable value gap that towers over the recent Onswik move.
The model uses four inputs to arrive at the fair value: growth rate, which has been adjusted to 18% to reflect reality rather than the overly conservative 12.71% default; a future PE ratio of 30 times earnings in 2031, down from today's 39 times, which accounts for the natural compression in valuation multiples as a company matures and grows larger; a discount rate of 7.5%, slightly above the default of 6.98%, to honestly account for the pipeline risks that still exist; and earnings by 2031 of approximately $48 to $50 billion, above the model's $41.5 billion, because at 18% growth and stable margins, that is where the numbers actually land.
See why 65 investors see Eli Lilly as 20% undervalued.
According to AHaron, that framework, using a 7.5% discount rate and a fair value of $1,477.03, treats Eli Lilly as materially undervalued even after strong one year and five year total returns. The narrative leans heavily on the GLP-1 franchise, the pending retatrutide trials, and oral orforglipron to justify a higher value than the current share price suggests.
The same storyline flags real pressure points. Debt is high, return on equity looks inflated by leverage, and pricing pressure around obesity drugs is already visible in lower self pay prices and tighter reimbursement. Revenue and earnings forecasts from analysts are also not projected to grow faster than the broader US market, which keeps a lid on how aggressive the valuation case can reasonably be.
Pulling those threads together, the most followed view on Simply Wall St still lands on a clear conclusion. Result: Fair Value of $1,477.03 (UNDERVALUED)
Still, two pressure points could upend that Eli Lilly optimism, including tougher pricing on obesity drugs and any safety or adherence setback in key GLP 1 trials.
Find out about the key risks to this Eli Lilly narrative.
Another View: Eli Lilly Through The P/E Lens
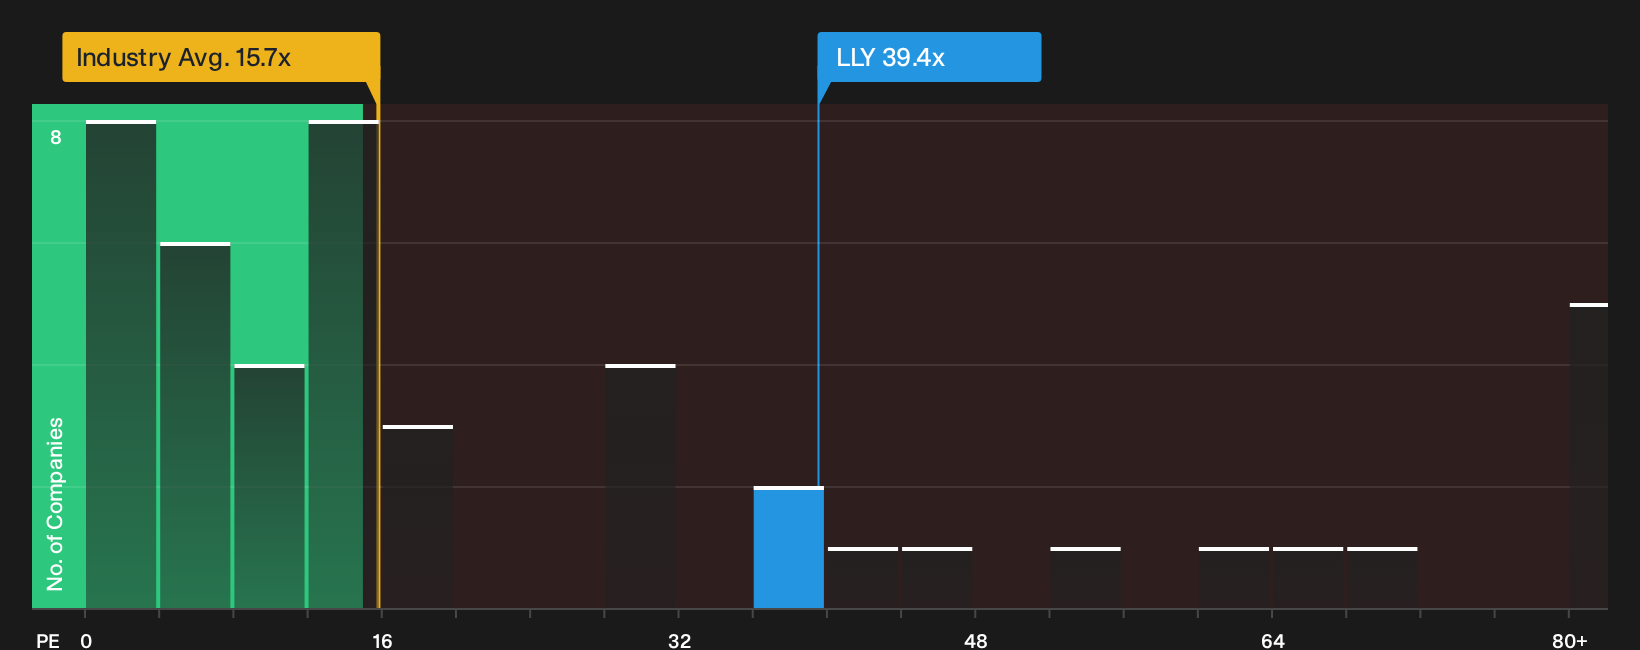
A different read on Eli Lilly comes from its current P/E of 39.4x. That is far above the US pharmaceuticals group on 15.7x, below a peer set at 49.2x, and under a fair ratio of 45.7x that the market could eventually move toward.
This mix points to a stock that already carries a heavy quality premium, yet still trades under the fair ratio. For investors, the question is simple: Is that premium a cushion that can absorb GLP-1 shocks, or a valuation risk if the growth story cools?
See what the numbers say about this price — find out in our valuation breakdown.
Next Steps
That mix of optimism and caution around Eli Lilly only matters if you test it against your own expectations and risk tolerance. Use the full breakdown of 3 key rewards and 1 important warning sign
Looking for more Eli Lilly investment ideas?
If Eli Lilly has your attention, do not stop with one stock. Use screeners to surface other opportunities that might fit your goals before the market does.
- Target potential upside by scanning a curated 16 high quality undiscovered gems that share strong fundamentals and may still be off most investors’ radar.
- Prioritize resilience by reviewing a 30 resilient stocks with low risk scores that highlights companies with steadier profiles when you want fewer surprises in your portfolio.
- Anchor your watchlist in quality by checking a list of solid balance sheet and fundamentals (24 results) focused on businesses built on stronger financial footing.
This article by Simply Wall St is general in nature. We provide commentary based on historical data and analyst forecasts only using an unbiased methodology and our articles are not intended to be financial advice. It does not constitute a recommendation to buy or sell any stock, and does not take account of your objectives, or your financial situation. We aim to bring you long-term focused analysis driven by fundamental data. Note that our analysis may not factor in the latest price-sensitive company announcements or qualitative material. Simply Wall St has no position in any stocks mentioned.
Have feedback on this article? Concerned about the content? Get in touch with us directly. Alternatively, email editorial-team@simplywallst.com