
ServiceNow (NOW) Shares Just Moved, What Is Drawing Attention?
Client wins put ServiceNow’s AI workflow tools in focus
Fresh client results are putting ServiceNow (NOW) under the microscope for investors. INRY’s rapid rollout of ServiceNow EmployeeWorks and early efficiency gains provide a concrete look at how the platform performs inside a real enterprise.
ServiceNow’s latest client wins arrive as the share price trades at US$137.78. Recent momentum has picked up, with a 30 day share price return of 8.5% and a 90 day gain of 40.1%. This comes even though the year to date move is down 6.6% and the 1 year total shareholder return is down 25.0%, while the 3 year total shareholder return of 24.5% and 5 year total shareholder return of 10.7% show a more mixed long run picture.
Scan other workflow and AI automation opportunities that are benefiting from similar client momentum with a curated list of 84 AI infrastructure stocks tied to real enterprise usage, not just headlines.
Bulls point to ServiceNow’s sticky workflow platform and fresh AI use cases. Bears see a rich multiple after a sharp 90 day run. Which side does the current valuation argument support next?
Most Popular Narrative: 47% Undervalued
ServiceNow’s most followed valuation storyline pegs fair value at $260.58 per share against a last close of $137.78, which frames the current price as heavily discounted before even looking at the details.
The market may still see a software company.
I increasingly see a utility for the digital economy.
And if that assessment is correct, ServiceNow's most profitable decade may not be behind it.
See why 93 investors see ServiceNow as 47% undervalued.
According to John_Eric, the narrative treats ServiceNow less as a typical software vendor and more as infrastructure that large enterprises depend on every day. That framing helps explain why a fair value of $260.58 implies a discount of roughly 47.1% to the current share price, even after a strong 90 day move.
The storyline leans on several pillars. It highlights years of earnings expansion, with profits growing 35.7% per year over the past 5 years, as well as forecasts that point to earnings growth of 25.5% per year over the next 3 years and revenue growth of 16% per year. It also leans on the SWS DCF model output, which places the future cash flow value at $268.25 per share, above both the last close and the narrative fair value estimate.
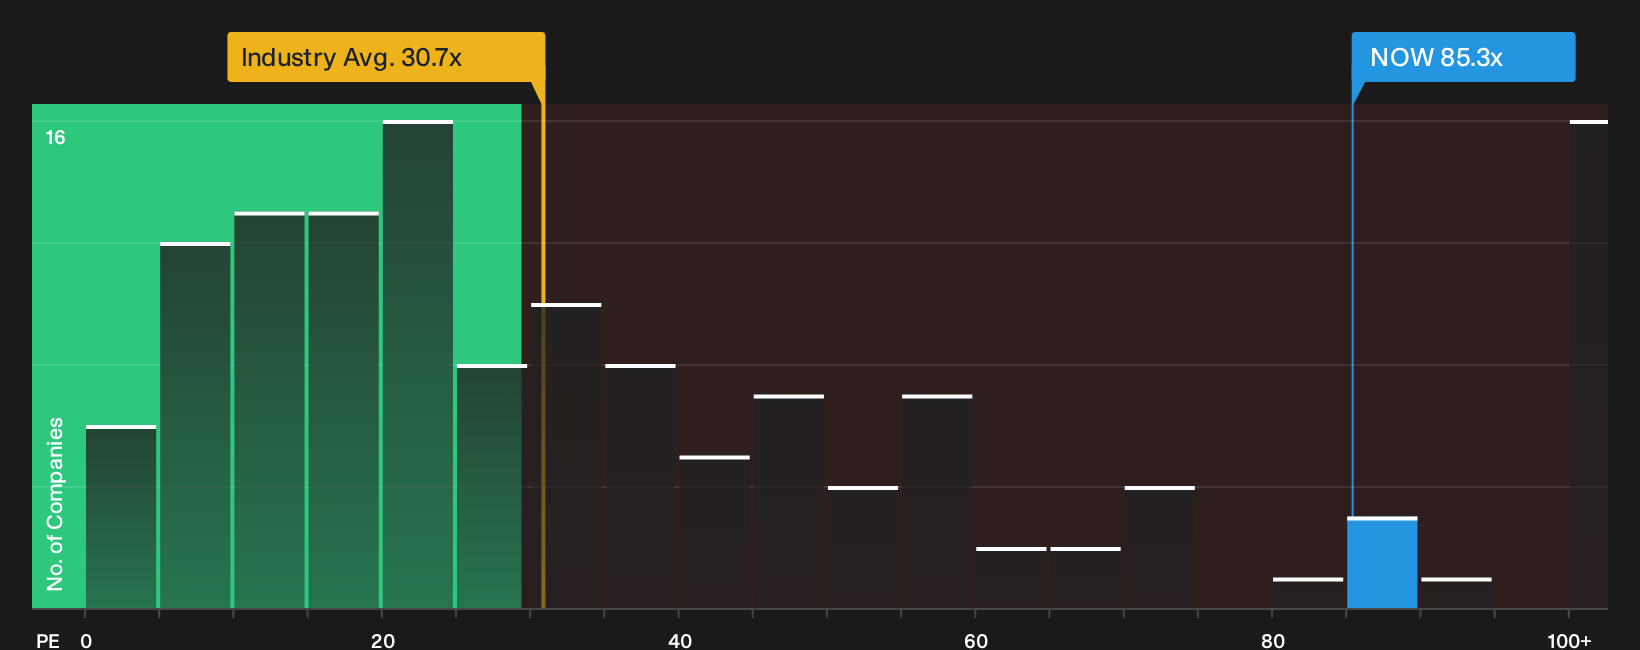
That optimism is balanced by clear risks that readers should keep in view. The stock trades on a P/E of 85.3x, which is higher than both the US Software industry average of 30.7x and the peer group average of 27.7x, and above an estimated fair P/E of 52.9x. Return on equity of 13.3% is described as low and forecast to remain below 20% in three years, net profit margins of 11.3% are lower than the 13.8% level reported last year, and all liabilities are funded through higher risk borrowing sources rather than customer deposits.
Supporters of the narrative argue that these headwinds are outweighed by a business that has grown earnings rapidly over the past half decade, generates what is described as high quality earnings, and is expected to grow profits faster than the broader US market, which is forecast at 17.6% per year. They also point to forecast revenue growth of 16% per year, which is expected to outpace the US market’s 13.7% annual rate, even if it is not high by growth stock standards.
Management and governance sit in the middle of the story rather than cleanly on either side of the bull or bear case. The board is considered experienced, with an average tenure of 7.5 years, and sufficiently independent, with 78% of directors classed as independent. At the same time, the management team is described as new, with an average tenure of 1.6 years, while CEO total compensation of $51.55m is higher than the $14.80m average for similarly sized US companies and has increased by more than 20% in the past year.
For investors weighing this narrative against market pricing, the tension comes down to which signal carries more weight. One side focuses on revenue and earnings growth forecasts, strong historical profit expansion, high quality earnings and the SWS DCF model output that places future cash flow value at $268.25 per share. The other side emphasizes the rich headline multiples, pressured recent returns, lower current margins compared to last year and a return profile that has lagged both the US market and the US Software industry over the past 12 months.
Result: Fair Value of $260.58 (UNDERVALUED)
Still, the narrative around ServiceNow could crack if rich P/E multiples meet slower workflow adoption or if the new debt fueled acquisitions fail to deliver.
Find out about the key risks to this ServiceNow narrative.
Another view on ServiceNow’s valuation
Multiples tell a very different story for ServiceNow. The stock trades on a P/E of 85.3x, while the US Software industry sits at 30.7x and peers at 27.7x. The fair ratio of 52.9x suggests the market could compress this gap, which raises real valuation risk for anyone relying purely on upside.
For a closer look at how this pricing compares with peers and where that fair ratio might pull the stock over time, See what the numbers say about this price — find out in our valuation breakdown.
Next Steps
After all this optimism and pushback around ServiceNow, it helps to step into the data yourself and decide where you land. If you want to zero in on what the market currently views as the upside, take a closer look at the 3 key rewards.
Looking for more ServiceNow investment ideas?
ServiceNow is only one angle on workflow and AI. If you want a fuller picture of what the market is offering right now, broadening your watchlist can help you spot opportunities earlier and avoid crowding into the same stories as everyone else.
- Target steadier potential with companies screened for balance sheet strength by reviewing our list of solid balance sheet and fundamentals (24 results) that prioritises resilience and financial discipline.
- Pursue value focused opportunities by scanning a curated set of 30 high quality undervalued stocks that combine quality fundamentals with pricing that still looks reasonable.
- Build a cash flow focused watchlist by checking out 8 dividend fortresses that aim to pair higher yields with more robust underlying businesses.
This article by Simply Wall St is general in nature. We provide commentary based on historical data and analyst forecasts only using an unbiased methodology and our articles are not intended to be financial advice. It does not constitute a recommendation to buy or sell any stock, and does not take account of your objectives, or your financial situation. We aim to bring you long-term focused analysis driven by fundamental data. Note that our analysis may not factor in the latest price-sensitive company announcements or qualitative material. Simply Wall St has no position in any stocks mentioned.
Have feedback on this article? Concerned about the content? Get in touch with us directly. Alternatively, email editorial-team@simplywallst.com