
What Is Drawing Attention To Bank Of Qingdao (SEHK:3866)?
Bank of Qingdao (SEHK:3866) has tapped China’s interbank market twice in September 2026, issuing a RMB 500 million three year bond for elderly care lending and a separate CNY 4.5 billion fixed rate bond due 2029.
For shareholders watching the ticker, Bank of Qingdao’s share price has eased over the past week and month, with 7 day and 30 day share price returns both down around 2%. However, the 90 day share price return of 14.39% and year to date gain of 29.06% point to momentum that has been building rather than fading.
Spot similar capital raising stories and balance sheet plays by scanning our hand picked list of solid balance sheet and fundamentals (202 results) alongside Bank of Qingdao’s latest bond moves.So is Bank of Qingdao’s bond push and long run share price strength a sign that the underlying franchise is being re rated, or just a sentiment swing that leaves the valuation stretched?
Price-to-Earnings of 4.5x: Is it justified?
Valuation for Bank of Qingdao currently hinges on a P/E of 4.5x, which sits below both its peers and the wider Hong Kong banks group, even after a strong share price run to HK$4.93.
The P/E ratio compares the current share price to earnings per share and gives a quick read on how much investors are paying for each unit of profit. For a lender like Bank of Qingdao, this metric helps frame whether the market is attaching a rich or modest label to that profit stream.
With the stock trading at a P/E of 4.5x against both the Hong Kong Banks industry average and peer average of 5.1x, the market is assigning a lower price tag to each dollar of earnings than it does to comparable banks. Compared to an estimated “fair” P/E of 7x, the gap is even wider, which points to a valuation level that some investors may view as modest relative to that reference ratio.
Explore the SWS fair ratio for Bank of Qingdao.
Result: Price-to-Earnings of 4.5x (UNDERVALUED)
Still, that low P/E on Bank of Qingdao can quickly look less generous if credit costs rise or if funding through the bond market becomes more expensive.
Find out about the key risks to this Bank of Qingdao narrative.
Another view on Bank of Qingdao’s value
The P/E ratio hints at a modest label for Bank of Qingdao, but the SWS DCF model tells a slightly different story. On that scorecard, the stock at HK$4.93 sits just under an estimated future cash flow value of HK$4.97, which suggests only a slim valuation cushion. If earnings or funding costs shift, how much comfort does that really leave?
Look into how the SWS DCF model arrives at its fair value.
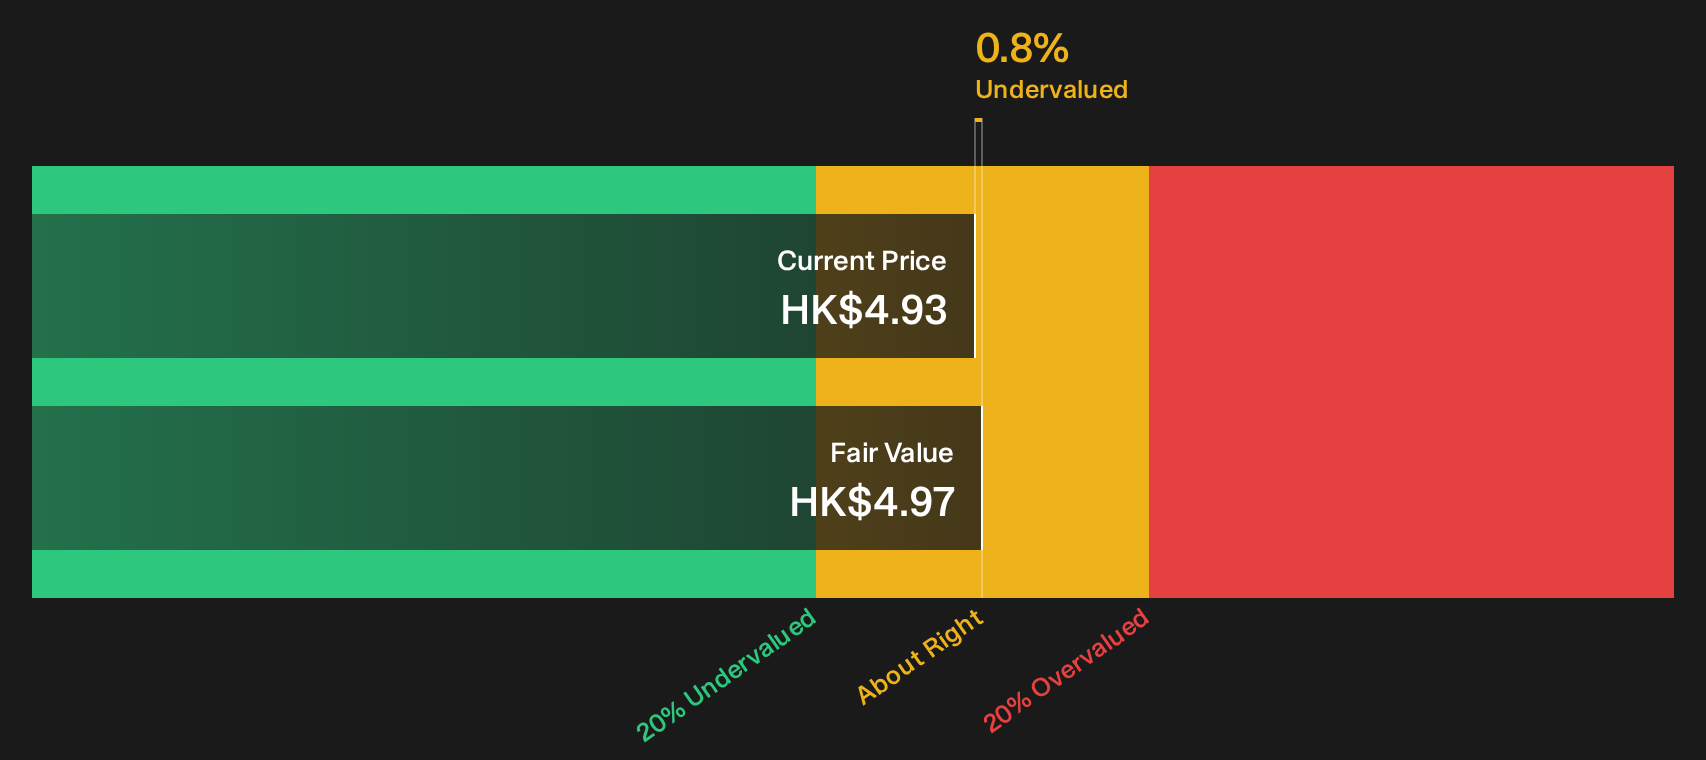
Simply Wall St performs a discounted cash flow (DCF) on every stock in the world every day (check out Bank of Qingdao for example). We show the entire calculation in full. You can track the result in your watchlist or portfolio and be alerted when this changes, or use our stock screener to discover 180 high quality undervalued stocks. If you save a screener we even alert you when new companies match - so you never miss a potential opportunity.
Next Steps
Sentiment around Bank of Qingdao may feel mixed, so use that as a prompt to move fast, pull up the numbers, and pressure test the story yourself. To see which positives investors are focusing on, review the 4 key rewards
Looking for more investment ideas beyond Bank of Qingdao?
If Bank of Qingdao has caught your attention, do not stop there. Broaden your opportunity set by scanning high quality stock ideas built from clear, transparent criteria.
- Target resilient growers with solid fundamentals by reviewing our 618 high quality undiscovered gems that might not yet be widely followed by the market.
- Prioritise capital preservation and steadier journeys by checking out 227 resilient stocks with low risk scores that score well on key risk metrics.
- Anchor your watchlist around reliable cash generators by filtering for 158 dividend fortresses that focus on income strength.
This article by Simply Wall St is general in nature. We provide commentary based on historical data and analyst forecasts only using an unbiased methodology and our articles are not intended to be financial advice. It does not constitute a recommendation to buy or sell any stock, and does not take account of your objectives, or your financial situation. We aim to bring you long-term focused analysis driven by fundamental data. Note that our analysis may not factor in the latest price-sensitive company announcements or qualitative material. Simply Wall St has no position in any stocks mentioned.
Have feedback on this article? Concerned about the content? Get in touch with us directly. Alternatively, email editorial-team@simplywallst.com