
Hoshizaki (TSE:6465) Shares Have Softened, Is The 37% Gap Below Fair Value Justified?
Attention on Hoshizaki (TSE:6465) has sharpened after the latest share price move, with the stock down about 7% over the past month while longer term returns remain mixed.
For context, the 30 day share price return is down 6.5%, while the year to date share price return is up 2.7%, and the 1 year total shareholder return is slightly negative. This suggests that momentum in Hoshizaki is softening after a steadier multi year run.
Scan how Hoshizaki stacks up against other quality industrials by reviewing our hand picked list of list of solid balance sheet and fundamentals (22 results).
Hoshizaki now trades well below both analyst targets and one intrinsic estimate, which puts the recent share pullback in a different light. Is the market discount still justified by the fundamentals investors see today?
Preferred P/E of 19.2x: Is it justified?
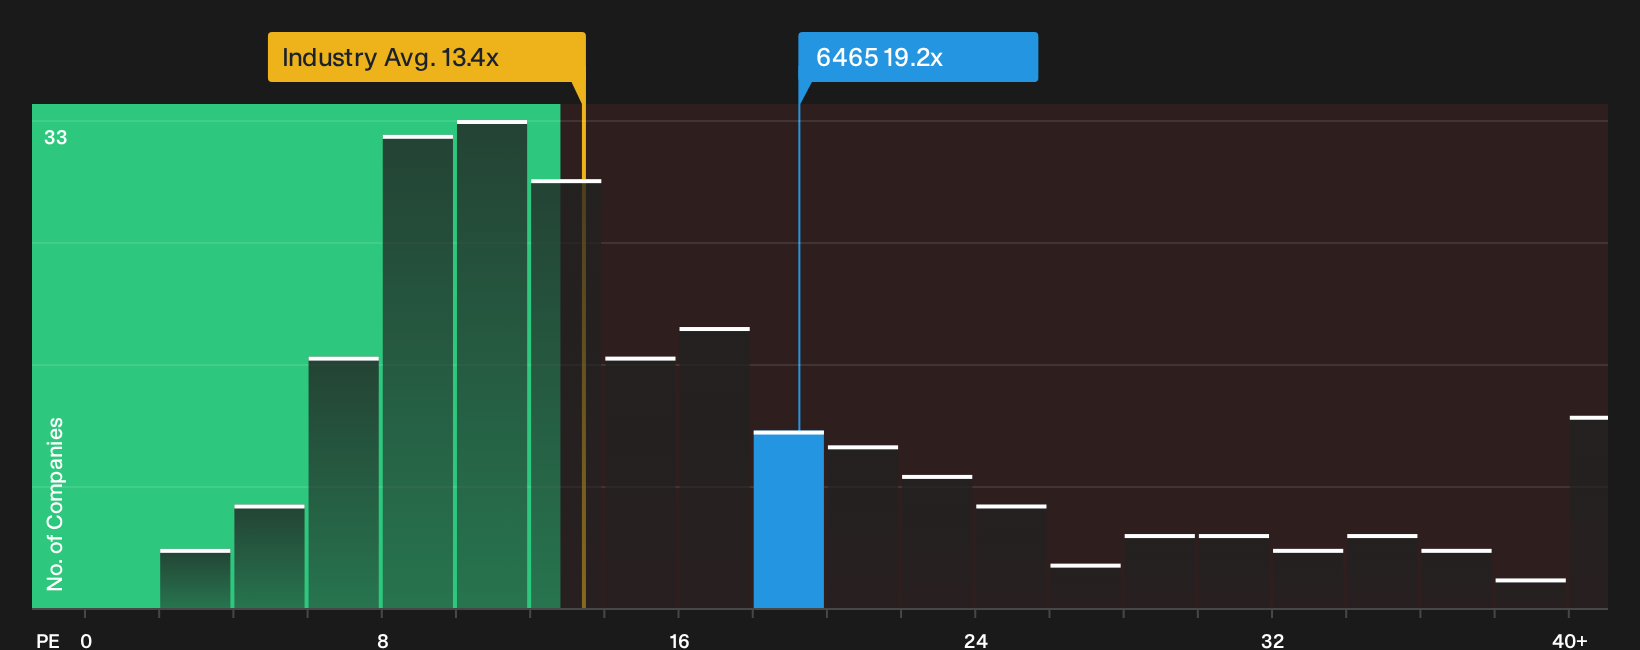
Valuation on Hoshizaki hinges on a P/E ratio of 19.2x, which investors are weighing against the recent share price of ¥5,347 and a softer share price trend.
The P/E multiple compares the current price to per share earnings and gives a quick read on what the market is willing to pay for each unit of profit. For a business like Hoshizaki that serves commercial kitchens across Japan, the Americas, Europe, and Asia, earnings power and how consistently those profits are generated often sit at the centre of the discussion.
On one side, the stock is described as good value versus its peer average P/E of 22.8x, suggesting investors are paying less for each unit of profit than for direct peers. On the other side, the same 19.2x P/E is described as expensive both against the broader JP Machinery industry average of 13.4x and against an estimated fair P/E of 17.4x that the market could move towards over time.
Explore the SWS fair ratio for Hoshizaki.
Result: Price-to-earnings of 19.2x (OVERVALUED).
DCF fair value points to a larger gap
Our DCF model estimates a fair value for Hoshizaki of ¥8,418.88, which compares to the current share price of ¥5,347 and implies trading at 36.5% below that intrinsic estimate.
The SWS DCF model projects future cash flows for the business and discounts them back to today using a required rate of return. This method ties the valuation to the cash the company is expected to generate rather than only to current earnings multiples or peer comparisons.
For Hoshizaki, which reports revenue of ¥521,008 and net income of ¥38,501 with earnings forecast to grow 10% per year, the DCF result frames the recent pullback as a widening gap between market price and one view of intrinsic worth.
Look into how the SWS DCF model arrives at its fair value.
Result: DCF fair value of ¥8,418.88 (UNDERVALUED).
Still, Hoshizaki faces potential pressure if commercial kitchen spending slows or if profit growth falls short of the 10% earnings forecast included in cash flow assumptions.
Find out about the key risks to this Hoshizaki narrative.
Another view on Hoshizaki’s valuation
The P/E story around Hoshizaki looks conflicted. The current 19.2x multiple is below direct peers at 22.8x, yet above both the JP Machinery industry on 13.4x and a fair ratio of 17.4x that the market could move towards. That gap hints at either a bargain against peers or a premium against broader benchmarks. Which risk matters more for you as an investor?
See what the numbers say about this price — find out in our valuation breakdown.
Simply Wall St performs a discounted cash flow (DCF) on every stock in the world every day (check out Hoshizaki for example). We show the entire calculation in full. You can track the result in your watchlist or portfolio and be alerted when this changes, or use our stock screener to discover 18 high quality undervalued stocks. If you save a screener we even alert you when new companies match - so you never miss a potential opportunity.
Next Steps
Mixed signals on Hoshizaki so far? If the tension between the P/E and DCF views interests you, move quickly and test the thesis against the positives that have investors optimistic. Start by reviewing its 4 key rewards
Looking for more Hoshizaki sized investment ideas?
Do not stop with Hoshizaki. Fresh ideas come from comparing it with other opportunities that share similar quality, value, or resilience profiles.
Use the Simply Wall Street screener to widen your opportunity set before momentum shifts away from you.
- Target strong upside potential by scanning through carefully filtered growth candidates using the 74 high quality undiscovered gems.
- Prioritise resilience first by focusing on companies that pair financial strength with disciplined balance sheets through the 21 resilient stocks with low risk scores.
- Hunt for value opportunities by zeroing in on shares that combine quality fundamentals with attractive pricing via the 18 high quality undervalued stocks.
This article by Simply Wall St is general in nature. We provide commentary based on historical data and analyst forecasts only using an unbiased methodology and our articles are not intended to be financial advice. It does not constitute a recommendation to buy or sell any stock, and does not take account of your objectives, or your financial situation. We aim to bring you long-term focused analysis driven by fundamental data. Note that our analysis may not factor in the latest price-sensitive company announcements or qualitative material. Simply Wall St has no position in any stocks mentioned.
Have feedback on this article? Concerned about the content? Get in touch with us directly. Alternatively, email editorial-team@simplywallst.com