
Sempra (SRE), Why Is It Back In Focus?
Dividend announcement puts Sempra in focus
Sempra (SRE) has drawn fresh attention after declaring a total dividend of $0.66 per share, with an ex-dividend date of September 24, 2026, an important timing detail for income focused investors.
Recent trading tells a mixed story. Sempra’s share price is down 8.62% over the past 30 days and 17.33% over 90 days, with a year-to-date share price return of down 13.13%. However, the 5-year total shareholder return of 45.15% shows that longer-term holders have still seen meaningful gains.
Scan other income-focused utilities moving on similar signals with our hand-picked 8 dividend fortresses for comparison with Sempra's latest payout and recent share price pressure.
Bulls see a regulated utility with a long dividend record, while bears point to recent share price weakness and softer growth. Which story does Sempra's current valuation support next?
Most Popular Narrative: 23% Undervalued
Sempra last closed at $77.93 while the most followed narrative anchors on a fair value of $101.59. As a result, the market price currently sits well below that reference point and puts the focus squarely on whether the long term investment plan is being fully reflected.
The thesis on Sempra has been reviewed and reaffirmed. The updated view places more weight on the scale and visibility of Texas grid investment, clearer regulatory outcomes at Oncor, and concrete progress on capital recycling and LNG execution as the core drivers of the story.
See why 25 investors see Sempra as 23% undervalued.
Result: Fair Value of $101.59 (UNDERVALUED)
Still, tighter rules in California or Texas, as well as any fresh delays or cost issues on Sempra’s LNG projects, could quickly weaken that undervalued narrative.
Find out about the key risks to this Sempra narrative.
Another angle on Sempra's valuation
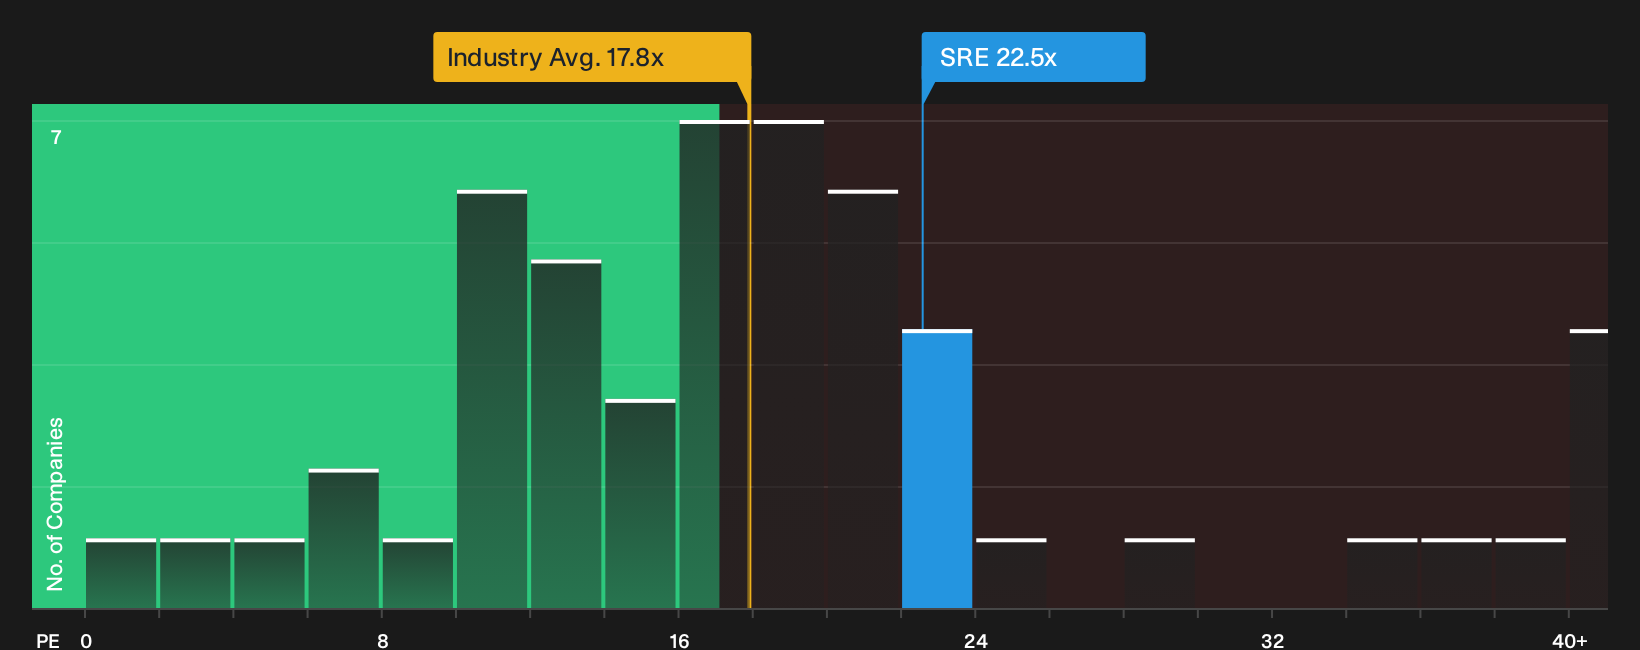
The fair value of $101.59 suggests Sempra looks undervalued in the narrative model, yet the P/E of 22.5x tells a different story. That rating is higher than the global integrated utilities group at 17.8x and above peers at 18.7x, even though the fair ratio sits at 23.9x. Is the gap a cushion or extra valuation risk?
Investors weighing that question may want to see what the numbers imply when earnings, peer comparisons and the fair ratio are laid out side by side, then test whether those assumptions fit their own expectations for Sempra's future. See what the numbers say about this price — find out in our valuation breakdown.
Next Steps
Mixed signals like Sempra's current valuation and share performance can split opinion, so move fast, review the underlying data and decide where you stand. To weigh both the upside and the concerns side by side, start with the 2 key rewards and 2 important warning signs.
Looking for more investment ideas beyond Sempra?
If Sempra has your attention, broaden your watchlist today and stress test your thinking against other opportunities that could sharpen your portfolio decisions.
- Target steadier potential returns by reviewing companies screened for resilience through the 31 resilient stocks with low risk scores.
- Hunt for value opportunities by comparing Sempra with our 31 high quality undervalued stocks that pairs quality fundamentals with attractive pricing.
- Strengthen your income pillar by lining up Sempra against yield focused opportunities in the 8 dividend fortresses.
This article by Simply Wall St is general in nature. We provide commentary based on historical data and analyst forecasts only using an unbiased methodology and our articles are not intended to be financial advice. It does not constitute a recommendation to buy or sell any stock, and does not take account of your objectives, or your financial situation. We aim to bring you long-term focused analysis driven by fundamental data. Note that our analysis may not factor in the latest price-sensitive company announcements or qualitative material. Simply Wall St has no position in any stocks mentioned.
Have feedback on this article? Concerned about the content? Get in touch with us directly. Alternatively, email editorial-team@simplywallst.com