
Shimizu (TSE:1803) Weighs Buybacks And Bonds, Is The Stock Below Fair Value?
Shimizu (TSE:1803) has put capital structure firmly on the agenda, with a 24 September 2026 board meeting set to weigh larger share buybacks and new zero coupon convertible bonds maturing in 2031 and 2033.
Despite the upcoming capital decisions, Shimizu’s share price has come under pressure, with the stock down 5.98% over the past day and 18.99% year to date. At the same time, total shareholder return over five years sits at 200.10%, suggesting long term momentum while shorter term sentiment has cooled ahead of the board meeting.
Scan how Shimizu’s capital moves compare with other construction and infrastructure stocks by reviewing the hand picked list of solid balance sheet and fundamentals (22 results).
Shimizu looks like a substantial business on paper, yet the recent slide and fresh capital plans raise a blunt question: Is this still a solid operation at a fair price today, or not?
Price-to-Earnings of 8.8x: Is it justified?
On simple valuation math, Shimizu trades on a P/E of 8.8x, which looks modest next to its recent share price weakness and the board’s capital plans.
The P/E ratio compares what investors pay today for each unit of earnings. For a construction and infrastructure player like Shimizu, this often reflects how much faith the market has in the durability of contracts, project risk, and future profitability rather than just the next quarter’s numbers.
Recent fundamentals give that headline number more context. Earnings over the past year grew very strongly at 128.5%, well ahead of the company’s 5 year average profit expansion of 22.5% per year and ahead of the Construction industry’s 25.9%. Net profit margins are currently 8.1%, up from 3.8% a year earlier, although a large one off gain of ¥81.5b is influencing the latest twelve month result, so some of that earnings strength may not repeat.
The market is still pricing Shimizu at a discount to peers despite that backdrop. The 8.8x P/E is lower than the JP Construction industry average of 11.2x and also below the peer group average of 12.6x. It is also under the estimated “fair” P/E of 14.9x that our regression based fair ratio points to. That is a level the market could potentially lean toward if current profit quality and growth are sustained or improve.
Explore the SWS fair ratio for Shimizu.
Result: Price-to-Earnings of 8.8x (UNDERVALUED)
Still, the recent 19% year to date share price fall and annual net income contraction of 5.6% could sour sentiment if boardroom capital moves disappoint investors.
Find out about the key risks to this Shimizu narrative.
Another View on Shimizu’s Value
There is a second lens investors are using on Shimizu. Our DCF model estimates the value of future cash flows at ¥2,249.79 per share, only about 1.8% above the current ¥2,210 price. That points to a stock that screens close to fair value rather than deeply mispriced.
For readers who want to see how those cash flow assumptions are built line by line, Look into how the SWS DCF model arrives at its fair value.
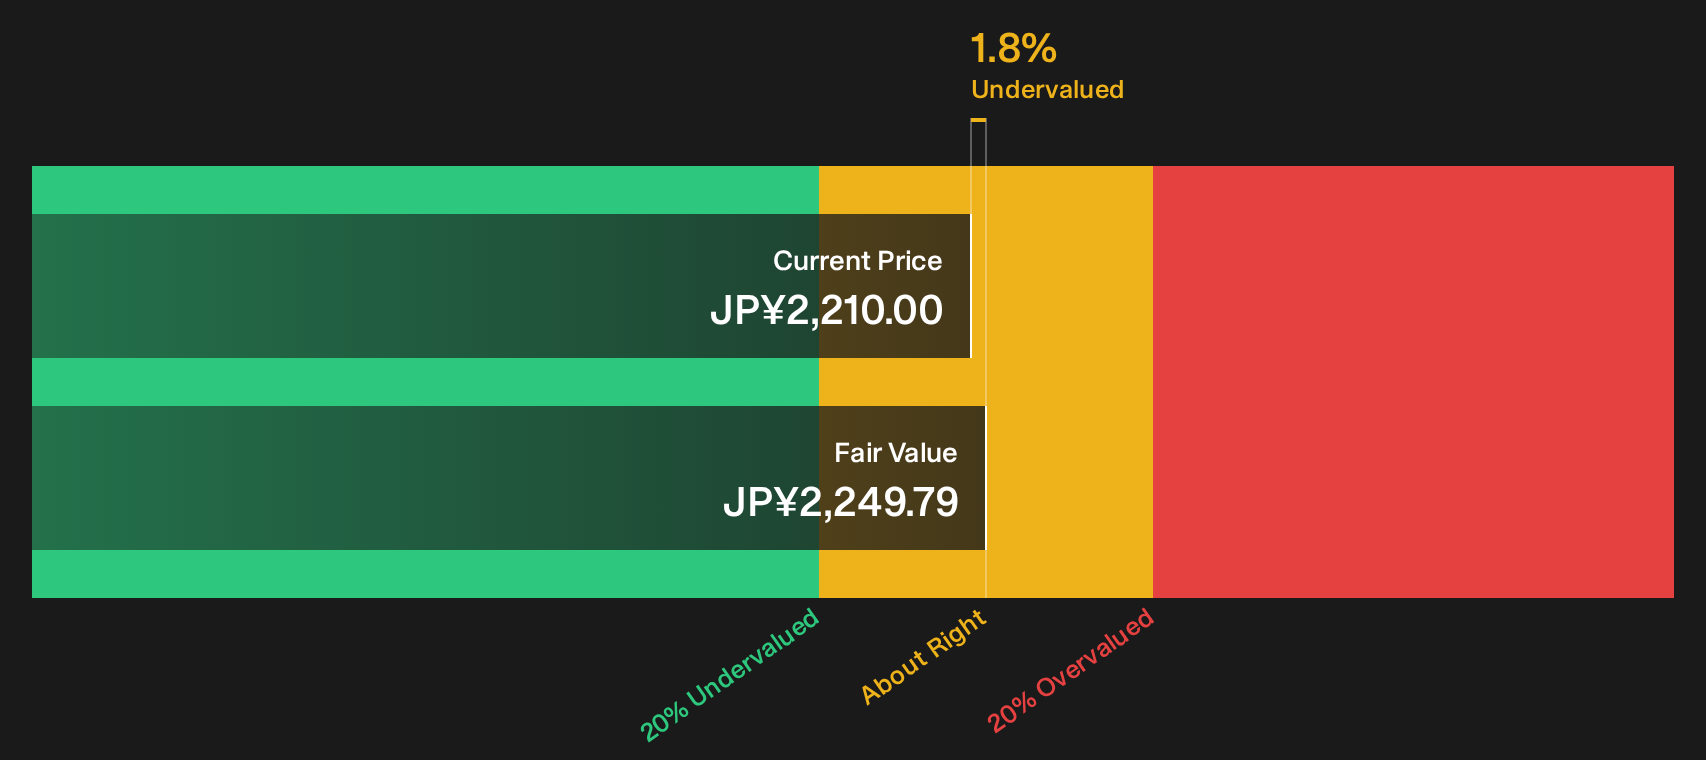
Simply Wall St performs a discounted cash flow (DCF) on every stock in the world every day (check out Shimizu for example). We show the entire calculation in full. You can track the result in your watchlist or portfolio and be alerted when this changes, or use our stock screener to discover 18 high quality undervalued stocks. If you save a screener we even alert you when new companies match - so you never miss a potential opportunity.
Next Steps
Feeling cautious after all this on Shimizu, or quietly optimistic about the mix of capital plans, risks and rewards being priced in right now? Move fast, review both sides of the story, and stress test your own thesis against the 4 key rewards and 3 important warning signs.
Looking for more Shimizu sized investment ideas?
Shimizu’s story is only one angle. If you stop here, you miss other opportunities that could better match your risk, income, or growth priorities.
- Target reliable compounding by reviewing companies that combine quality fundamentals with attractive pricing through the 18 high quality undervalued stocks.
- Strengthen your income stream by scanning for higher yielding payers in the 14 dividend fortresses.
- Dial down portfolio stress by focusing on financially robust businesses in the 21 resilient stocks with low risk scores.
This article by Simply Wall St is general in nature. We provide commentary based on historical data and analyst forecasts only using an unbiased methodology and our articles are not intended to be financial advice. It does not constitute a recommendation to buy or sell any stock, and does not take account of your objectives, or your financial situation. We aim to bring you long-term focused analysis driven by fundamental data. Note that our analysis may not factor in the latest price-sensitive company announcements or qualitative material. Simply Wall St has no position in any stocks mentioned.
Have feedback on this article? Concerned about the content? Get in touch with us directly. Alternatively, email editorial-team@simplywallst.com