
Goldwin (TSE:8111) After FTSE All World Exit Is The Stock Cheap Or Fairly Priced
Goldwin (TSE:8111) was removed from the FTSE All-World Index in September 2026. This index change can prompt passive fund selling and mechanical portfolio reshuffling rather than reflecting a direct view on business fundamentals.
Goldwin's latest share price of ¥2,182 comes after a year where the share price return has declined 14.87% year to date, while the 1-year total shareholder return is down 12.39%. This points to fading longer term momentum despite a recent uptick, which is likely linked to the FTSE All-World Index removal and related passive selling pressure.
Scan how other consumer names are reacting to similar index reshuffles by checking our hand-picked 18 high quality undervalued stocks list, which combines solid fundamentals with potential pricing gaps.
Bulls point to Goldwin’s growing revenue and profit, while bears see index-related selling and a weak 3 year return. Which side do the current valuation numbers lean toward next?
Price-to-Earnings of 12.9x: Is it justified?
Goldwin trades on a P/E of 12.9x, and that level screens as inexpensive when set against both its peers and the wider luxury segment.
The P/E ratio compares what investors pay for each unit of current earnings. For a branded apparel business like Goldwin, which sells everything from outerwear to sports gear, this benchmark helps you judge what the market is charging for its profit stream.
Analysts see earnings growing 5.6% a year, while the SWS DCF model points to a future cash flow value of ¥3,298.02 versus a share price of ¥2,182. Taken together with the fair P/E estimate of 15x, the current 12.9x multiple suggests the market is pricing Goldwin at a discount that could narrow if those profit expectations materialise.
Compared with the JP Luxury industry average P/E of 15.3x and the peer average of 21.6x, Goldwin trades on a clearly lower multiple. That gap, alongside the 15x fair P/E marker, signals a valuation that skews conservative rather than optimistic.
Explore the SWS fair ratio for Goldwin.
Result: Price-to-earnings of 12.9x (UNDERVALUED).
Still, Goldwin’s 31.6% decline in 3 year total return and recent FTSE index removal could keep sentiment fragile if passive outflows or performance concerns persist.
Find out about the key risks to this Goldwin narrative.
Another view on Goldwin's value
The SWS DCF model values Goldwin at ¥3,298.02 per share versus the current ¥2,182 price, which points to the stock trading at a discount on a cash flow basis. That gap hints at upside if those future cash flows arrive as modelled, but it also raises a question. Is the market correctly pricing in slower forecast growth and funding risk, or leaning too far toward caution?
Look into how the SWS DCF model arrives at its fair value.
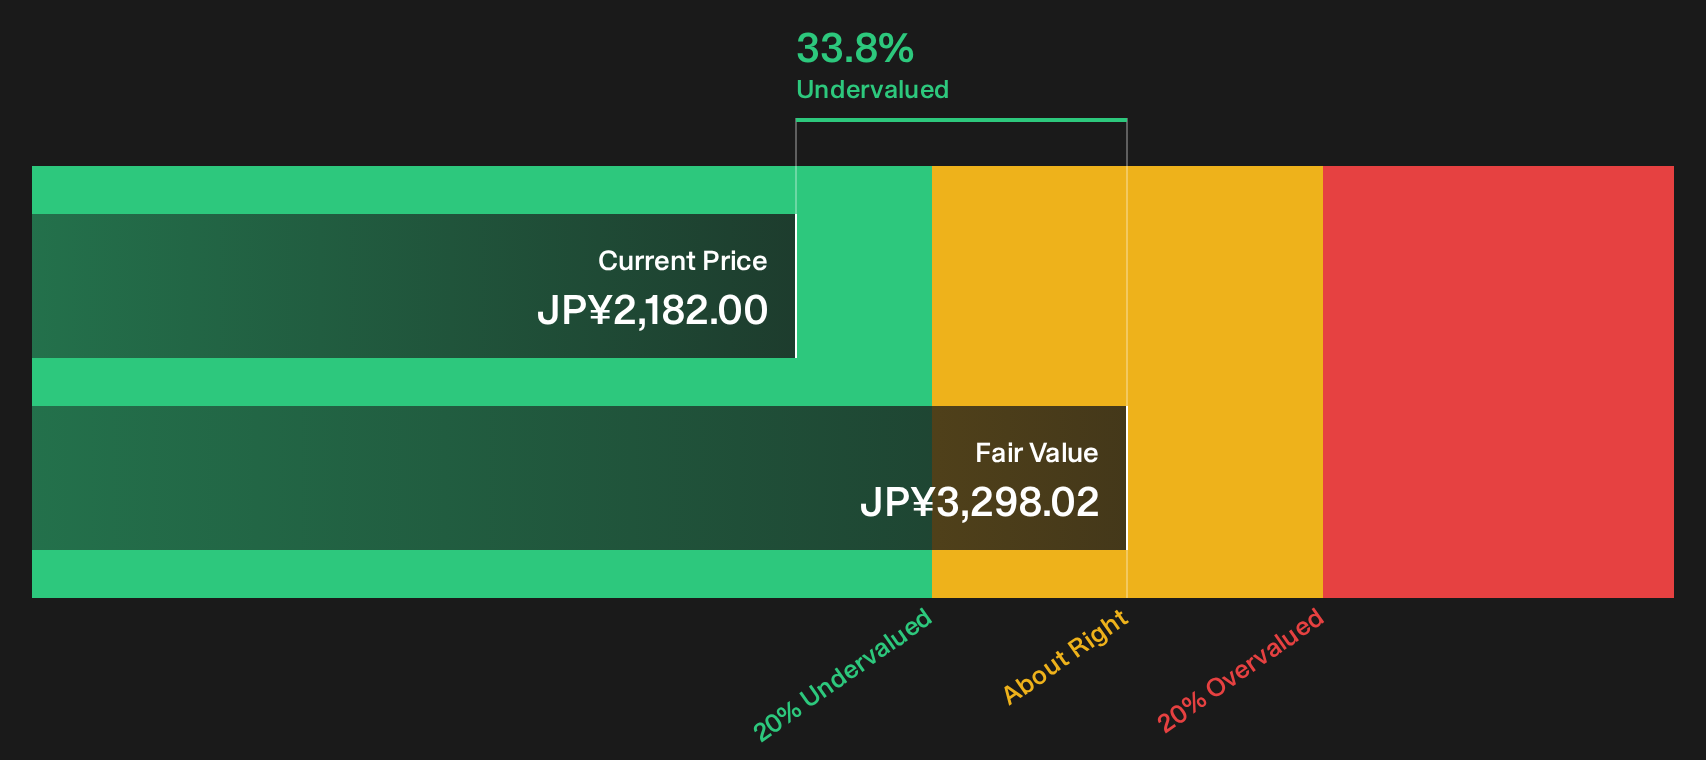
Simply Wall St performs a discounted cash flow (DCF) on every stock in the world every day (check out Goldwin for example). We show the entire calculation in full. You can track the result in your watchlist or portfolio and be alerted when this changes, or use our stock screener to discover 18 high quality undervalued stocks. If you save a screener we even alert you when new companies match - so you never miss a potential opportunity.
Next Steps
Mixed signals around Goldwin's valuation and sentiment do not need to leave you on the fence. Instead, move quickly, review the full picture, and weigh up the 4 key rewards and 1 important warning sign
Looking for more ideas beyond Goldwin?
If you stop with Goldwin, you risk missing other opportunities. Put a few more quality candidates on your radar and give your research real depth.
- Target value first, then see which companies combine solid fundamentals with potential mispricing by scanning the 18 high quality undervalued stocks.
- Prioritise resilience and protect the downside by filtering for businesses with strong finances using the list of solid balance sheet and fundamentals (22 results).
- Hunt for overlooked opportunities that the crowd has not focused on yet by working through the 74 high quality undiscovered gems.
This article by Simply Wall St is general in nature. We provide commentary based on historical data and analyst forecasts only using an unbiased methodology and our articles are not intended to be financial advice. It does not constitute a recommendation to buy or sell any stock, and does not take account of your objectives, or your financial situation. We aim to bring you long-term focused analysis driven by fundamental data. Note that our analysis may not factor in the latest price-sensitive company announcements or qualitative material. Simply Wall St has no position in any stocks mentioned.
Have feedback on this article? Concerned about the content? Get in touch with us directly. Alternatively, email editorial-team@simplywallst.com