
Exchange Income (TSX:EIF) Could Be 18% Undervalued Following Record Results And Raised Guidance
Exchange Income (TSX:EIF) drew fresh attention after it reported record second quarter results in August 2026. The company also lifted its full year guidance and raised its monthly dividend for shareholders.
That backdrop has been feeding into the trading action. Exchange Income’s share price is now at CA$123.80 after a 1-day share price return of 1.92% and a 7-day share price return of 5.36%. However, the 90-day share price return declined 5.34%, while the 1-year total shareholder return of 75.73% and 5-year total shareholder return of 245.92% point to momentum that has been building over a longer stretch.
Scan beyond Exchange Income and see how its mix of record results, raised guidance, and dividend strength compares with other businesses in our curated list of 5 high quality undervalued stocks.
Bulls see Exchange Income’s record quarter, stronger guidance, and higher dividend as validation of the current price. Bears point to the recent 90 day pullback. Which side do the valuation numbers lean toward?
Most Popular Narrative: 18% Undervalued
On the most followed narrative, Exchange Income’s fair value sits at CA$151.82 against a last close of CA$123.80, which frames the recent pullback very differently for investors weighing the record quarter.
The recent acquisition of Canadian North, combined with a long-term exclusive contract with the Government of Nunavut, uniquely positions the company as the primary provider of essential air services to remote Arctic regions. This leverages multi-decade demand for connectivity and government infrastructure investment in the North, creating a stable, recurring revenue base and supporting future revenue and EBITDA growth.
See why 38 investors see Exchange Income as 18% undervalued.
The narrative uses a discount rate of 7.77% and arrives at a fair value of CA$151.82 for Exchange Income, which is above the current CA$123.80 share price. That gap equates to an 18.5% discount to the narrative estimate of intrinsic worth.
Analysts contributing to this storyline also link the higher fair value to a forecast revenue growth rate of 9.58% and an 8.10% profit margin, which are the inputs driving the CA$4.9b revenue and CA$395.4m earnings assumptions by 2029 set out in the narrative. Those estimates sit behind the implied future P/E of about 30.3x used in the fair value calculation.
Alongside the narrative work, the SWS DCF model flags a similar conclusion, with Exchange Income trading at CA$123.80 compared with an estimated future cash flow value of CA$196.79. That DCF outcome lines up with the separate statement that the stock is trading 37.1% below an internal fair value estimate.
Result: Fair Value of CA$151.82 (UNDERVALUED)
Still, the bullish Exchange Income narrative leans heavily on integration going smoothly and maintenance costs staying manageable, with any setback in these areas capable of undermining the fair value case.
Find out about the key risks to this Exchange Income narrative.
Another View: What Multiples Say About Exchange Income
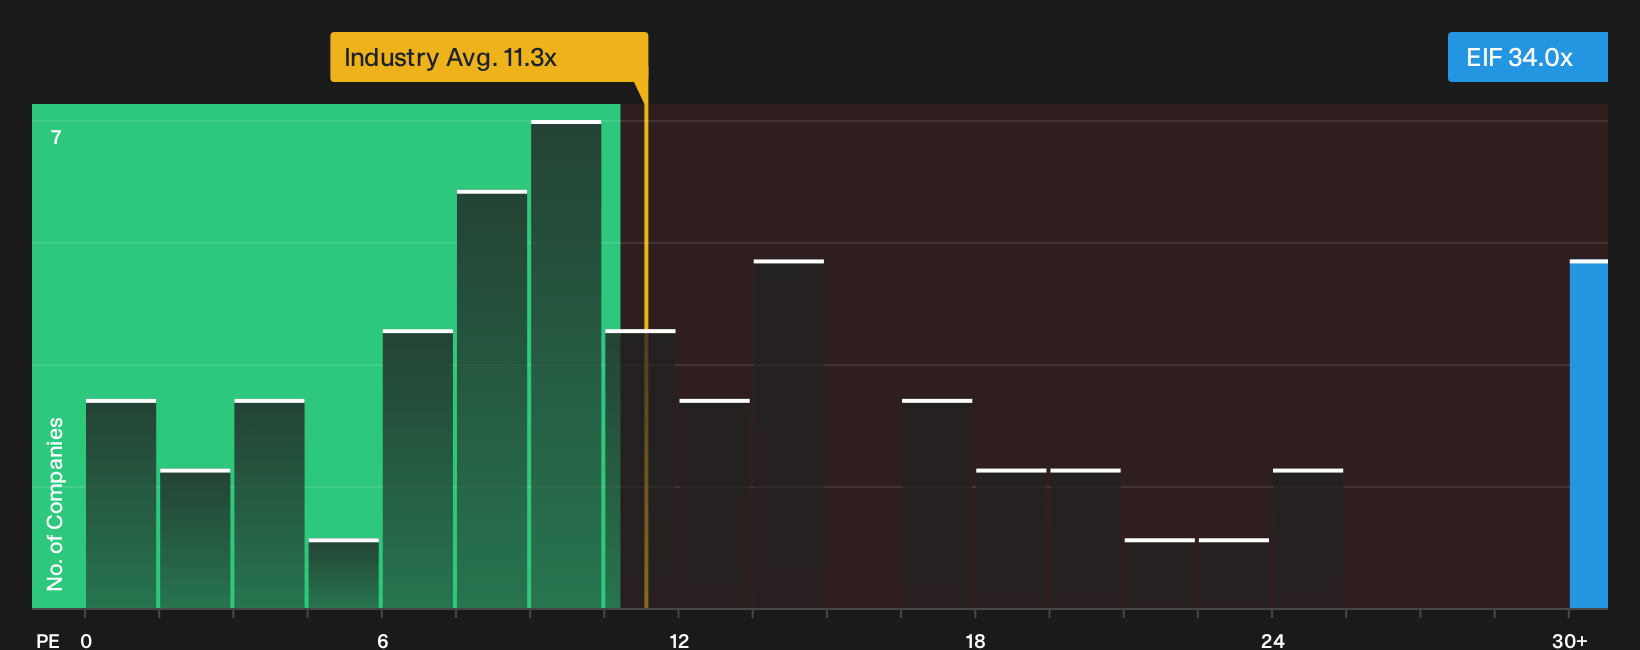
On a simple earnings multiple, Exchange Income tells a different story. The stock trades on a P/E of 34x, compared with 11.2x for the global airlines group and a peer average of 21.8x, while the fair ratio points to 21.2x as a level the market could move toward over time.
That gap means investors are currently paying a much richer price than both industry and peer benchmarks, and even above the fair ratio. This raises the question of how much of the recent growth and guidance upgrade is already embedded in today’s CA$123.80 share price.
See what the numbers say about this price — find out in our valuation breakdown.
Next Steps
Mixed messages around Exchange Income’s valuation and risk profile are clear, so move quickly, stress test the numbers, and weigh both sides for yourself with 4 key rewards and 3 important warning signs
Looking for more investment ideas beyond Exchange Income?
If Exchange Income has sharpened your focus on valuation and quality, expand your watchlist with other opportunities that match your style and risk tolerance.
- Target stronger balance sheets and steadier financial footing with a carefully curated list of solid balance sheet and fundamentals (7 results) that can help you stress test your next idea.
- Hunt for potential mispricing by scanning a focused 5 high quality undervalued stocks that highlights businesses where fundamentals and market price may be out of sync.
- Prioritise resilience and sleep-better-at-night holdings using a 8 resilient stocks with low risk scores that filters for companies with lower overall risk scores.
This article by Simply Wall St is general in nature. We provide commentary based on historical data and analyst forecasts only using an unbiased methodology and our articles are not intended to be financial advice. It does not constitute a recommendation to buy or sell any stock, and does not take account of your objectives, or your financial situation. We aim to bring you long-term focused analysis driven by fundamental data. Note that our analysis may not factor in the latest price-sensitive company announcements or qualitative material. Simply Wall St has no position in any stocks mentioned.
Have feedback on this article? Concerned about the content? Get in touch with us directly. Alternatively, email editorial-team@simplywallst.com