
Japan Exchange Group (TSE:8697) Lifted Guidance, Is The Upside Already Priced In?
Japan Exchange Group (TSE:8697) raised its earnings and dividend forecasts for the year ending March 31, 2027, after updating assumptions for higher average daily trading values and volumes across its markets.
The stock has reacted quickly to the upgraded guidance, with a 1-day share price return of 2.59% taking Japan Exchange Group to ¥2,333. The 7-day share price return of 4.36% adds to already strong year-to-date momentum of 35.29% and a 1-year total shareholder return of 42.83%.
Scan beyond Japan Exchange Group and spot other exchange and financial infrastructure stocks with surging interest by using our hand picked 21 resilient stocks with low risk scores as a starting shortlist.
Japan Exchange Group now combines upgraded profit and dividend guidance with a sharp share price move in just a few trading sessions. The business looks solid, but are investors already paying full price for that strength?
Price-to-Earnings of 26x: Is it justified?
Valuation is now front and center for Japan Exchange Group. The stock closed at ¥2,333, and on a P/E of 26x it is priced far above both its own estimated fair P/E and peers in the Japanese capital markets sector.
The P/E ratio compares the current share price to earnings per share. For an exchange operator like Japan Exchange Group, that metric effectively shows how much investors are willing to pay for each unit of profit, given its high quality earnings, strong 28.1% return on equity and its role in the domestic capital markets.
At 26x earnings, the market is assigning Japan Exchange Group a much richer tag than the JP Capital Markets industry average of 12.9x and the peer average of 10.8x. It is also well ahead of the estimated fair P/E of 17.1x. This is a level the valuation work suggests could be more aligned with the underlying fundamentals if sentiment cools or trading conditions normalise.
Explore the SWS fair ratio for Japan Exchange Group.
Result: Price-to-Earnings of 26x (OVERVALUED)
Still, Japan Exchange Group faces risks if trading activity cools or if regulatory changes alter fee structures. These factors could challenge the current rerating story.
Find out about the key risks to this Japan Exchange Group narrative.
Another View on Japan Exchange Group’s Valuation
The first check used a simple P/E comparison and flagged Japan Exchange Group as expensive. A second angle uses the SWS DCF model, which values future cash flows at ¥1,156.84 per share. Against the current ¥2,333 price, the stock screens as heavily overvalued on this framework.
This clash between earnings based pricing and our DCF model raises a practical question for investors. Which risk matters more right now: paying up for recent strength, or waiting to see if expectations cool back towards the cash flow value.Look into how the SWS DCF model arrives at its fair value.
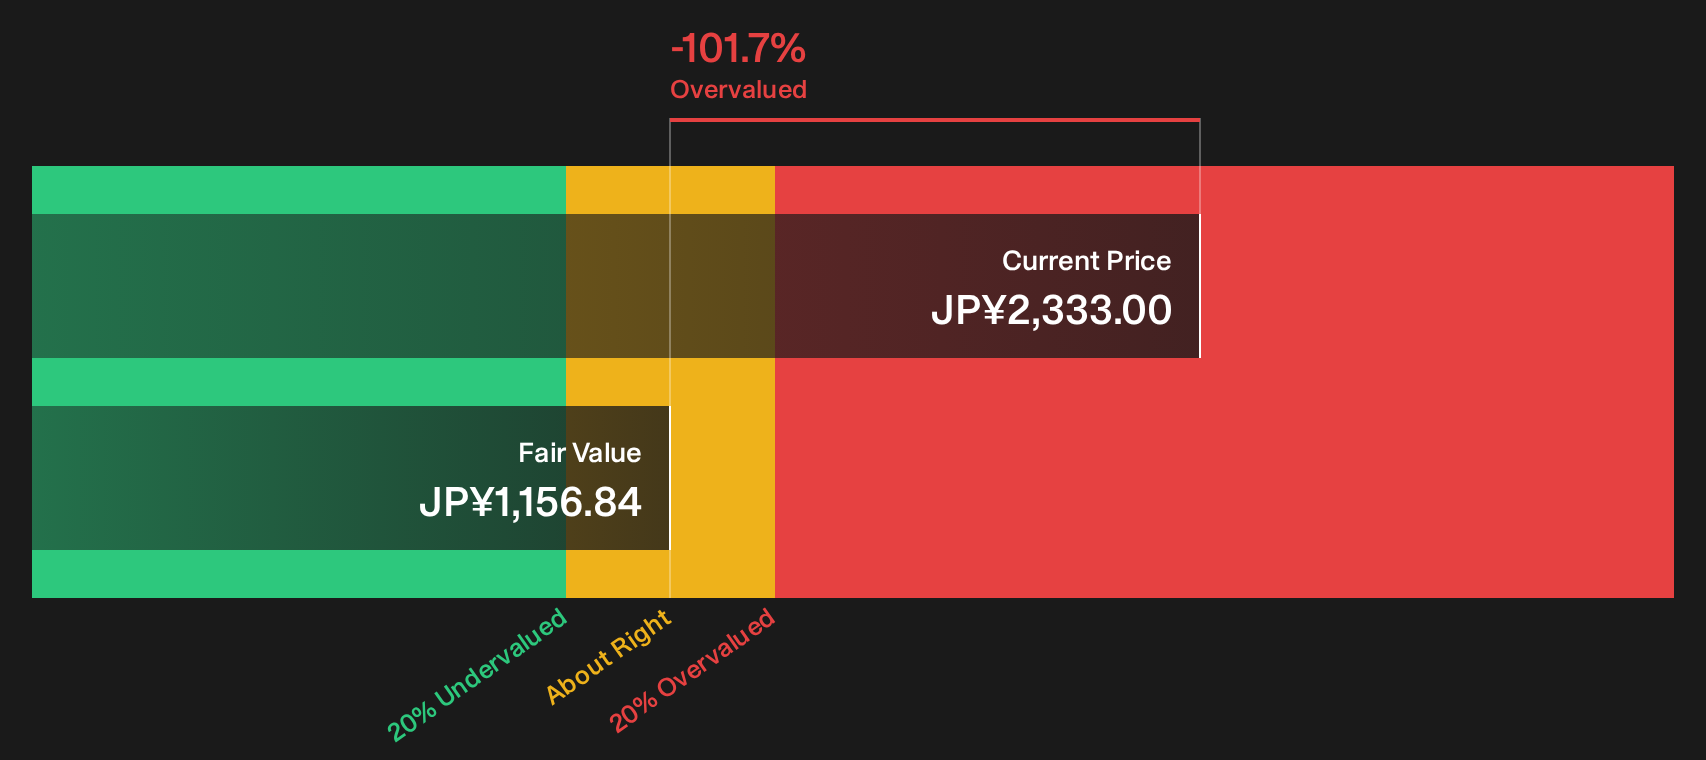
Simply Wall St performs a discounted cash flow (DCF) on every stock in the world every day (check out Japan Exchange Group for example). We show the entire calculation in full. You can track the result in your watchlist or portfolio and be alerted when this changes, or use our stock screener to discover 18 high quality undervalued stocks. If you save a screener we even alert you when new companies match - so you never miss a potential opportunity.
Next Steps
Sentiment on Japan Exchange Group is split, which is exactly when fresh eyes matter most. Move quickly, review the numbers yourself and weigh both the upside and the risk signals highlighted by our 1 key reward and 1 important warning sign.
Looking for more ideas beyond Japan Exchange Group?
Do not stop with Japan Exchange Group. Use this rerating as a cue to widen your watchlist and pressure test fresh opportunities against the same valuation lens.
- Spot potential bargains early and stress test your thesis with our curated list of quality opportunities flagged as undervalued using the 18 high quality undervalued stocks.
- Build a portfolio that aims for consistency by focusing on companies with sturdy finances and robust fundamentals sourced from the list of solid balance sheet and fundamentals (22 results).
- Hunt for underfollowed potential where fundamentals already look solid but attention is still light by scanning the 74 high quality undiscovered gems.
This article by Simply Wall St is general in nature. We provide commentary based on historical data and analyst forecasts only using an unbiased methodology and our articles are not intended to be financial advice. It does not constitute a recommendation to buy or sell any stock, and does not take account of your objectives, or your financial situation. We aim to bring you long-term focused analysis driven by fundamental data. Note that our analysis may not factor in the latest price-sensitive company announcements or qualitative material. Simply Wall St has no position in any stocks mentioned.
Have feedback on this article? Concerned about the content? Get in touch with us directly. Alternatively, email editorial-team@simplywallst.com