
3 Bank Stocks With Corporate Treasury Exposure As Bond Yields Pressure Cash Flows
Bond markets have grabbed the steering wheel, with the U.S. 10 year Treasury yield hovering around 5.2% and putting fresh scrutiny on every cash flow on corporate balance sheets. Investors who understand where cash really moves within global banks and financial groups may find this shift hard to ignore. This article walks through three stocks exposed to these rate and liquidity cross currents and explains how the recent news could matter for you.
The stocks covered below are only a small sample, and the full screen surfaced 70 more global banks and financial groups with equally compelling corporate treasury and cash-management narratives that are not included here. To identify and analyze the highest conviction ideas in this space, go straight to the Global Banks and Financial Institutions with Strong Corporate Treasury and Cash-Management Businesses screener.
Industrial and Commercial Bank of China (SEHK:1398)
Overview: Industrial and Commercial Bank of China is a large Beijing based lender providing corporate, retail, treasury and related financial services globally.
Operations: ICBC generates most revenue from Corporate Banking at CN¥355.3b, followed by Personal Banking at CN¥216.6b and Treasury Operations at CN¥106.5b.
Market Cap: HK$3,211.7b
Industrial and Commercial Bank of China is a central player in this screener because its scale in corporate and institutional banking directly links to global cash management, treasury and transaction flows that matter when interest rates and funding costs move quickly.
"Digital transformation is expanding ICBC's reach. This is evidenced by rapid growth in mobile banking (MAU >265 million), increased open banking transaction volumes (CN¥249 trillion), and the integration of AI in risk management and customer operations. Together, these developments are expected to enhance long-term cost efficiency and support margin expansion."
What happens to those efficiency gains if a single unseen pressure on corporate treasury demand quietly shifts the balance on future profitability.
That pressure point is where the story gets interesting, and the full narrative for Industrial and Commercial Bank of China shows how those treasury swings could reshape returns and risk as digital volumes keep accelerating.

Lion Finance Group (LSE:BGEO)
Overview: Lion Finance Group provides retail, SME, and corporate banking and investment services across Georgia, Armenia, and selected adjacent markets.
Operations: Lion Finance Group reports GEL 1,174 million from Armenian Financial Services and GEL 182 million from Other Businesses, plus a GEL 3,133 million segment adjustment.
Market Cap: £6.2b
Lion Finance Group fits this treasury and cash-management screen because its corporate and investment banking franchises rely heavily on transaction services, foreign exchange and liquidity solutions for regional clients operating in a higher rate environment.
"Accelerating digital adoption and continued success in digital transformation are expanding Lion Finance Group's active customer base (for example, 15.5% year-over-year growth in digital users, 1.7 million digital banking customers, and 86% of loans issued digitally). This has supported growth in revenue and efficiency gains, which have contributed to changes in net margins over time."
A key consideration is what may occur if a single, unseen pressure on regional funding costs quietly shifts the balance between recent digital gains and future profitability.
That funding shift is exactly where the story starts to accelerate, and the full narrative for Lion Finance Group lays out how Lion Finance Group’s digital gains could either compound or be masked by it.

Northrim BanCorp (NRIM)
Overview: Northrim BanCorp is an Anchorage based commercial bank serving businesses and professionals with deposits, loans, treasury services, payments and wealth management.
Operations: Northrim BanCorp generates about $152 million from Community Banking, $40 million from Home Mortgage Lending and $26 million from Specialty Finance, all in the United States.
Market Cap: $556 million
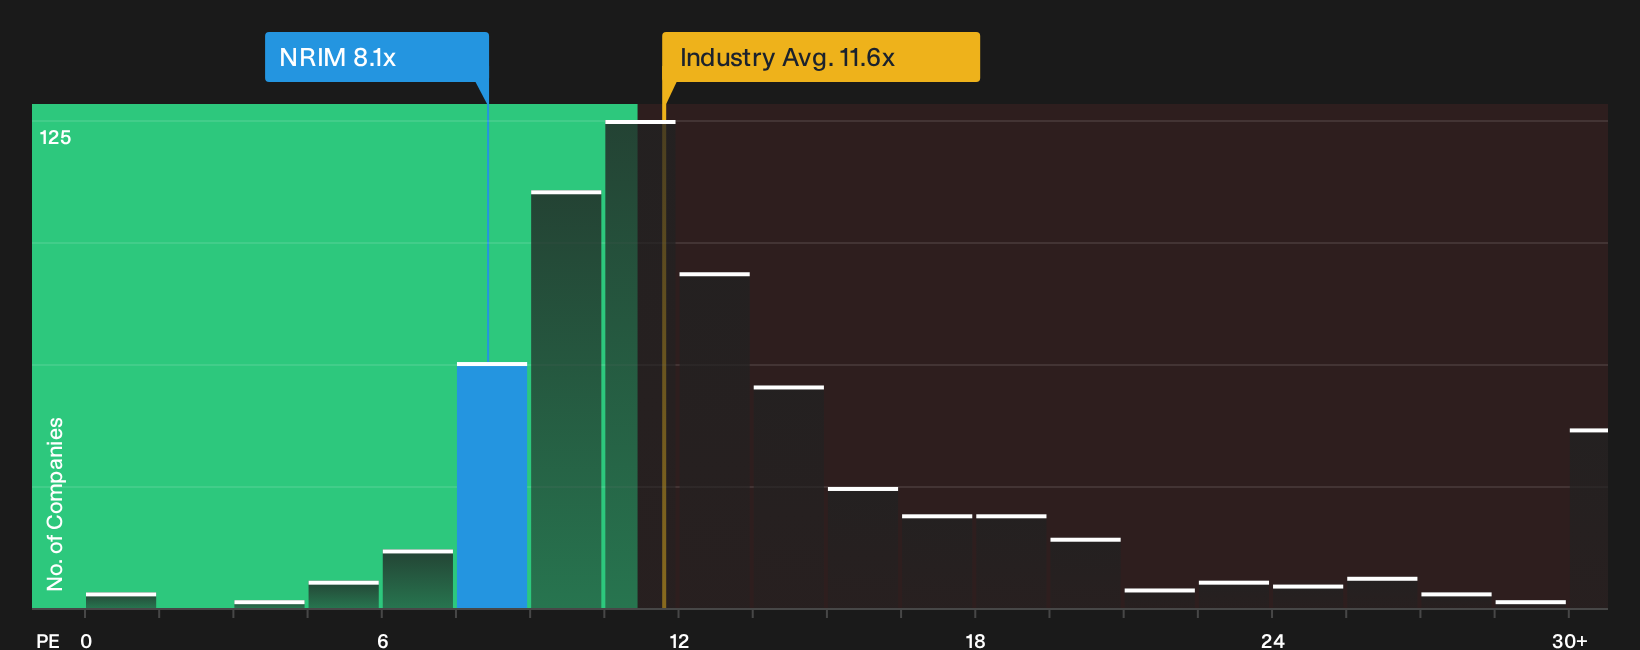
Northrim BanCorp ties into this screener through its focus on business customers whose deposits, working capital loans and payment flows are directly exposed to higher rates and liquidity needs. Earnings are on a low P/E of 8.1x with high quality profitability and a 31.8% net margin. The valuation gap to peers depends on how one unseen pressure shapes those business cash balances and fee streams.
When that pressure on business cash starts to bite, the 6 key rewards and 1 important warning sign shows how Northrim BanCorp's valuation gap could react before headlines catch up.
Seeking Alternatives Before The Crowd
Fresh opportunities move fast. Breakout stories build momentum, weaker ideas keep dropping, and under the radar for now stocks will not stay quiet. Act now to review potential opportunities early.
- Explore durable income streams while other investors stay glued to headlines by reviewing the 162 dividend fortresses that focus on consistency, balance sheet strength and sustained cash returns.
- Identify early movers in cutting edge computing before attention goes mainstream by scanning the 25 quantum computing stocks curated for firms building real products, not just presentations.
- Monitor critical materials behind energy and technology demand by using the 17 top copper producer stocks that highlights producers with meaningful scale and tangible operating footprints.
This article by Simply Wall St is general in nature. We provide commentary based on historical data and analyst forecasts only using an unbiased methodology and our articles are not intended to be financial advice. It does not constitute a recommendation to buy or sell any stock, and does not take account of your objectives, or your financial situation. We aim to bring you long-term focused analysis driven by fundamental data. Note that our analysis may not factor in the latest price-sensitive company announcements or qualitative material. Simply Wall St has no position in any stocks mentioned.
Have feedback on this article? Concerned about the content? Get in touch with us directly. Alternatively, email editorial-team@simplywallst.com